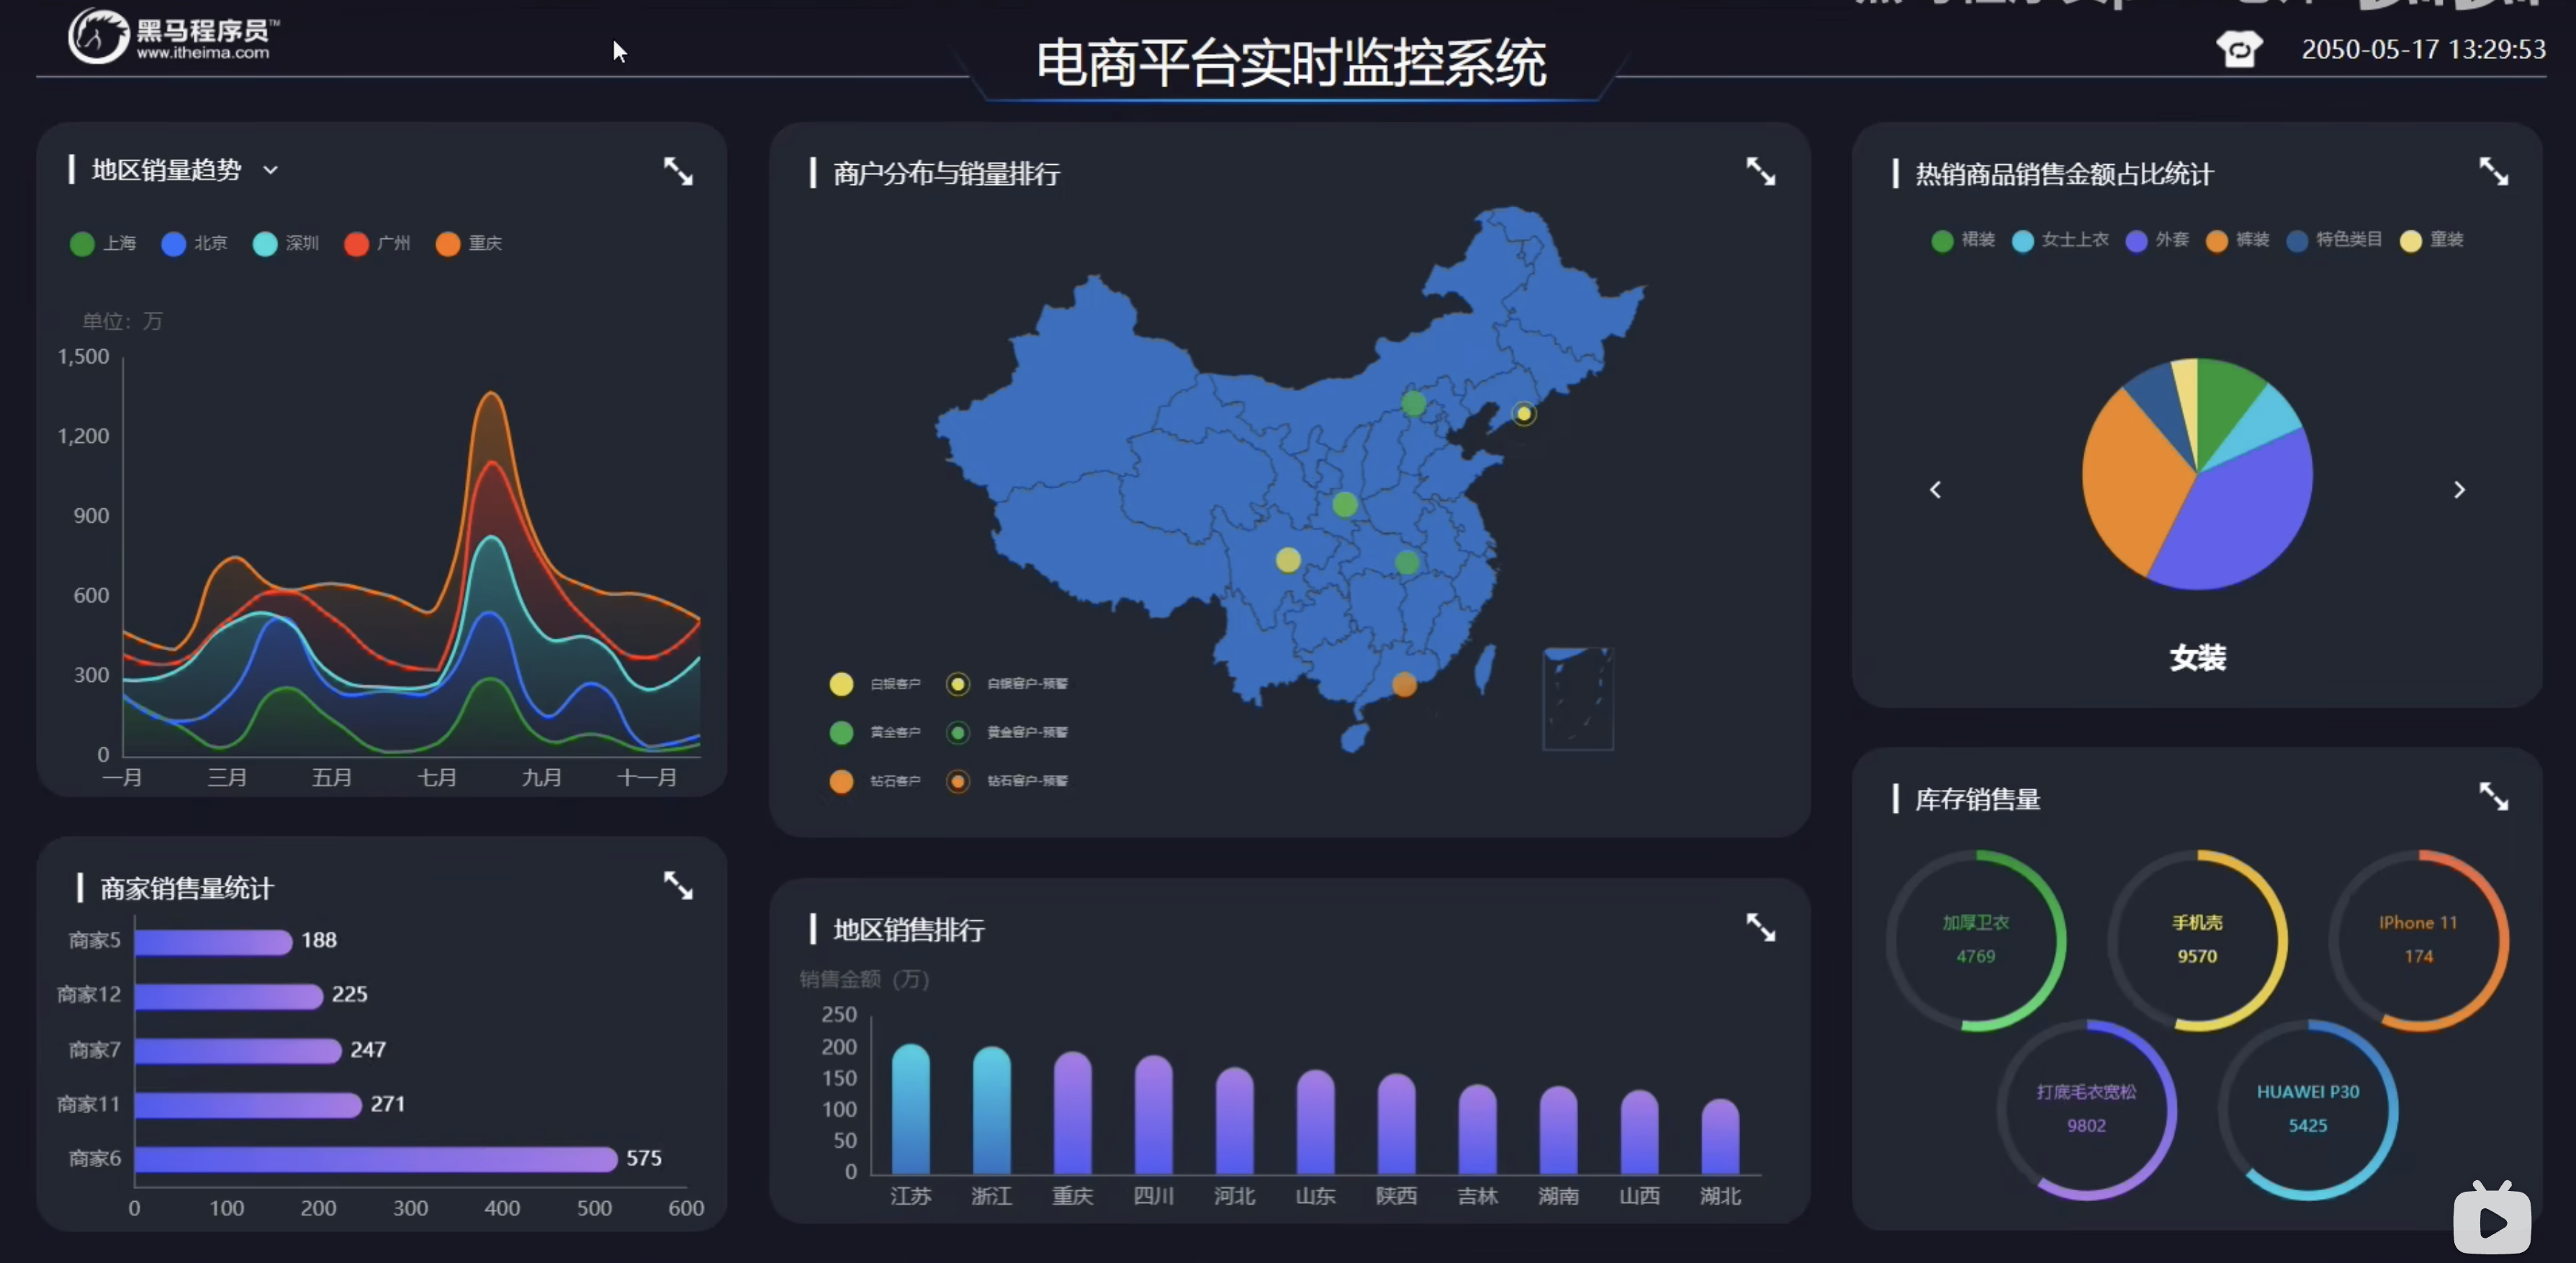
电商平台数据可视化实时监控系统学习
本文最后更新于 2024-09-10,文章内容可能已经过时。
项目演示

技术选型
EchartsVue2 Vue-router VuexWebpackWebscoketAxiosKoa2
Echarts快速上手
接下来会通过
vue2项目来快速搭建Echarts入门案例!
创建vue2项目
版本 nodejs v12.18.3npm 6.14.6
vue create vue2-big-screen-demo输入好命令后,回撤选择
vue2版本且等待项目创建完成后进入项目目录并执行以下命令来启动我们创建好的项目!
cd vue2-big-screen-demonpm run serve项目目录结构如下, 删除
HelloWord相关文件,并按照以下目录结构创建!
├── README.md
├── babel.config.js
├── jsconfig.json
├── package-lock.json
├── package.json
├── public
│   ├── favicon.ico
│   └── index.html
├── src
│   ├── App.vue
│   ├── assets
│   │   └── logo.png
│   ├── components
│   ├── main.js
│   ├── plugins  # 第三方插件
│   │   └── echarts
│   │       └── index.js
│   ├── utils
│   └── views
│       └── echarts-demo
│           └── index.vue
└── vue.config.js
安装 echarts
安装
echarts后,并创建index.js来分别引入ehcarts所需功能!
npm install echarts --save
plugins/echarts/index.js
// 引入 echarts 核心模块,核心模块提供了 echarts 使用必须要的接口。
import * as echarts from "echarts/core";
// 引入柱状图图表,图表后缀都为 Chart
import { BarChart, LineChart, PieChart } from "echarts/charts";
// 引入标题,提示框,直角坐标系,数据集,内置数据转换器组件,组件后缀都为 Component
import {
  TitleComponent,
  TooltipComponent,
  GridComponent,
  DatasetComponent,
  TransformComponent,
} from "echarts/components";
// 标签自动布局、全局过渡动画等特性
import { LabelLayout, UniversalTransition } from "echarts/features";
// 引入 Canvas 渲染器,注意引入 CanvasRenderer 或者 SVGRenderer 是必须的一步
import { CanvasRenderer } from "echarts/renderers";

// 注册必须的组件
echarts.use([
  TitleComponent,
  TooltipComponent,
  GridComponent,
  DatasetComponent,
  TransformComponent,
  BarChart,
  LineChart,
  PieChart,
  LabelLayout,
  UniversalTransition,
  CanvasRenderer,
]);

export default echarts;
使用 echarts
创建
views文件夹,其次创建一个demo-page
views/echarts-demo/index.vue
<template>
  <div class="app-container">
    <div ref="chart" class="demo"></div>
  </div>
</template>

<script>
import echarts from "@/plugins/echarts";
export default {
  name: "EchartsDemo",
  data() {
    return {};
  },
  methods: {
    initChart() {
      let chartRef = this.$refs.chart;
      let myChart = echarts.init(chartRef);
      let option = {
        title: {
          text: "ECharts 入门示例",
        },
        tooltip: {},
        legend: {
          data: ["销量"],
        },
        xAxis: {},
        yAxis: {},
        series: [
          {
            name: "销量",
            type: "bar",
            data: [5, 20, 36, 10, 10, 20],
          },
        ],
      };
      myChart.setOption(option);
    },
  },
  mounted() {
    this.$nextTick(() => {
      this.initChart();
    });
  },
};
</script>

<style scoped>
.demo {
  width: 500px;
  height: 500px;
}
</style>
这样以来,
echarts相关代码准备好了,接下来,我们需要对vue2进行一些配置!打开
vue.config.js我们需要关掉eslint并增加路径别名@配置!
在 echarts init dom 初始化元素的时候,一定要给dom元素设置宽高,这样以来才能显示出echarts图表!
const { defineConfig } = require('@vue/cli-service')
const path = require("path");
module.exports = defineConfig({
  transpileDependencies: true,
  // 关闭 eslint 检查
  lintOnSave: false,
  configureWebpack: {
    resolve: {
      // 配置路径别名
      alias: {
        "@": path.resolve(__dirname, "src/"),
      },
    },
  },
});
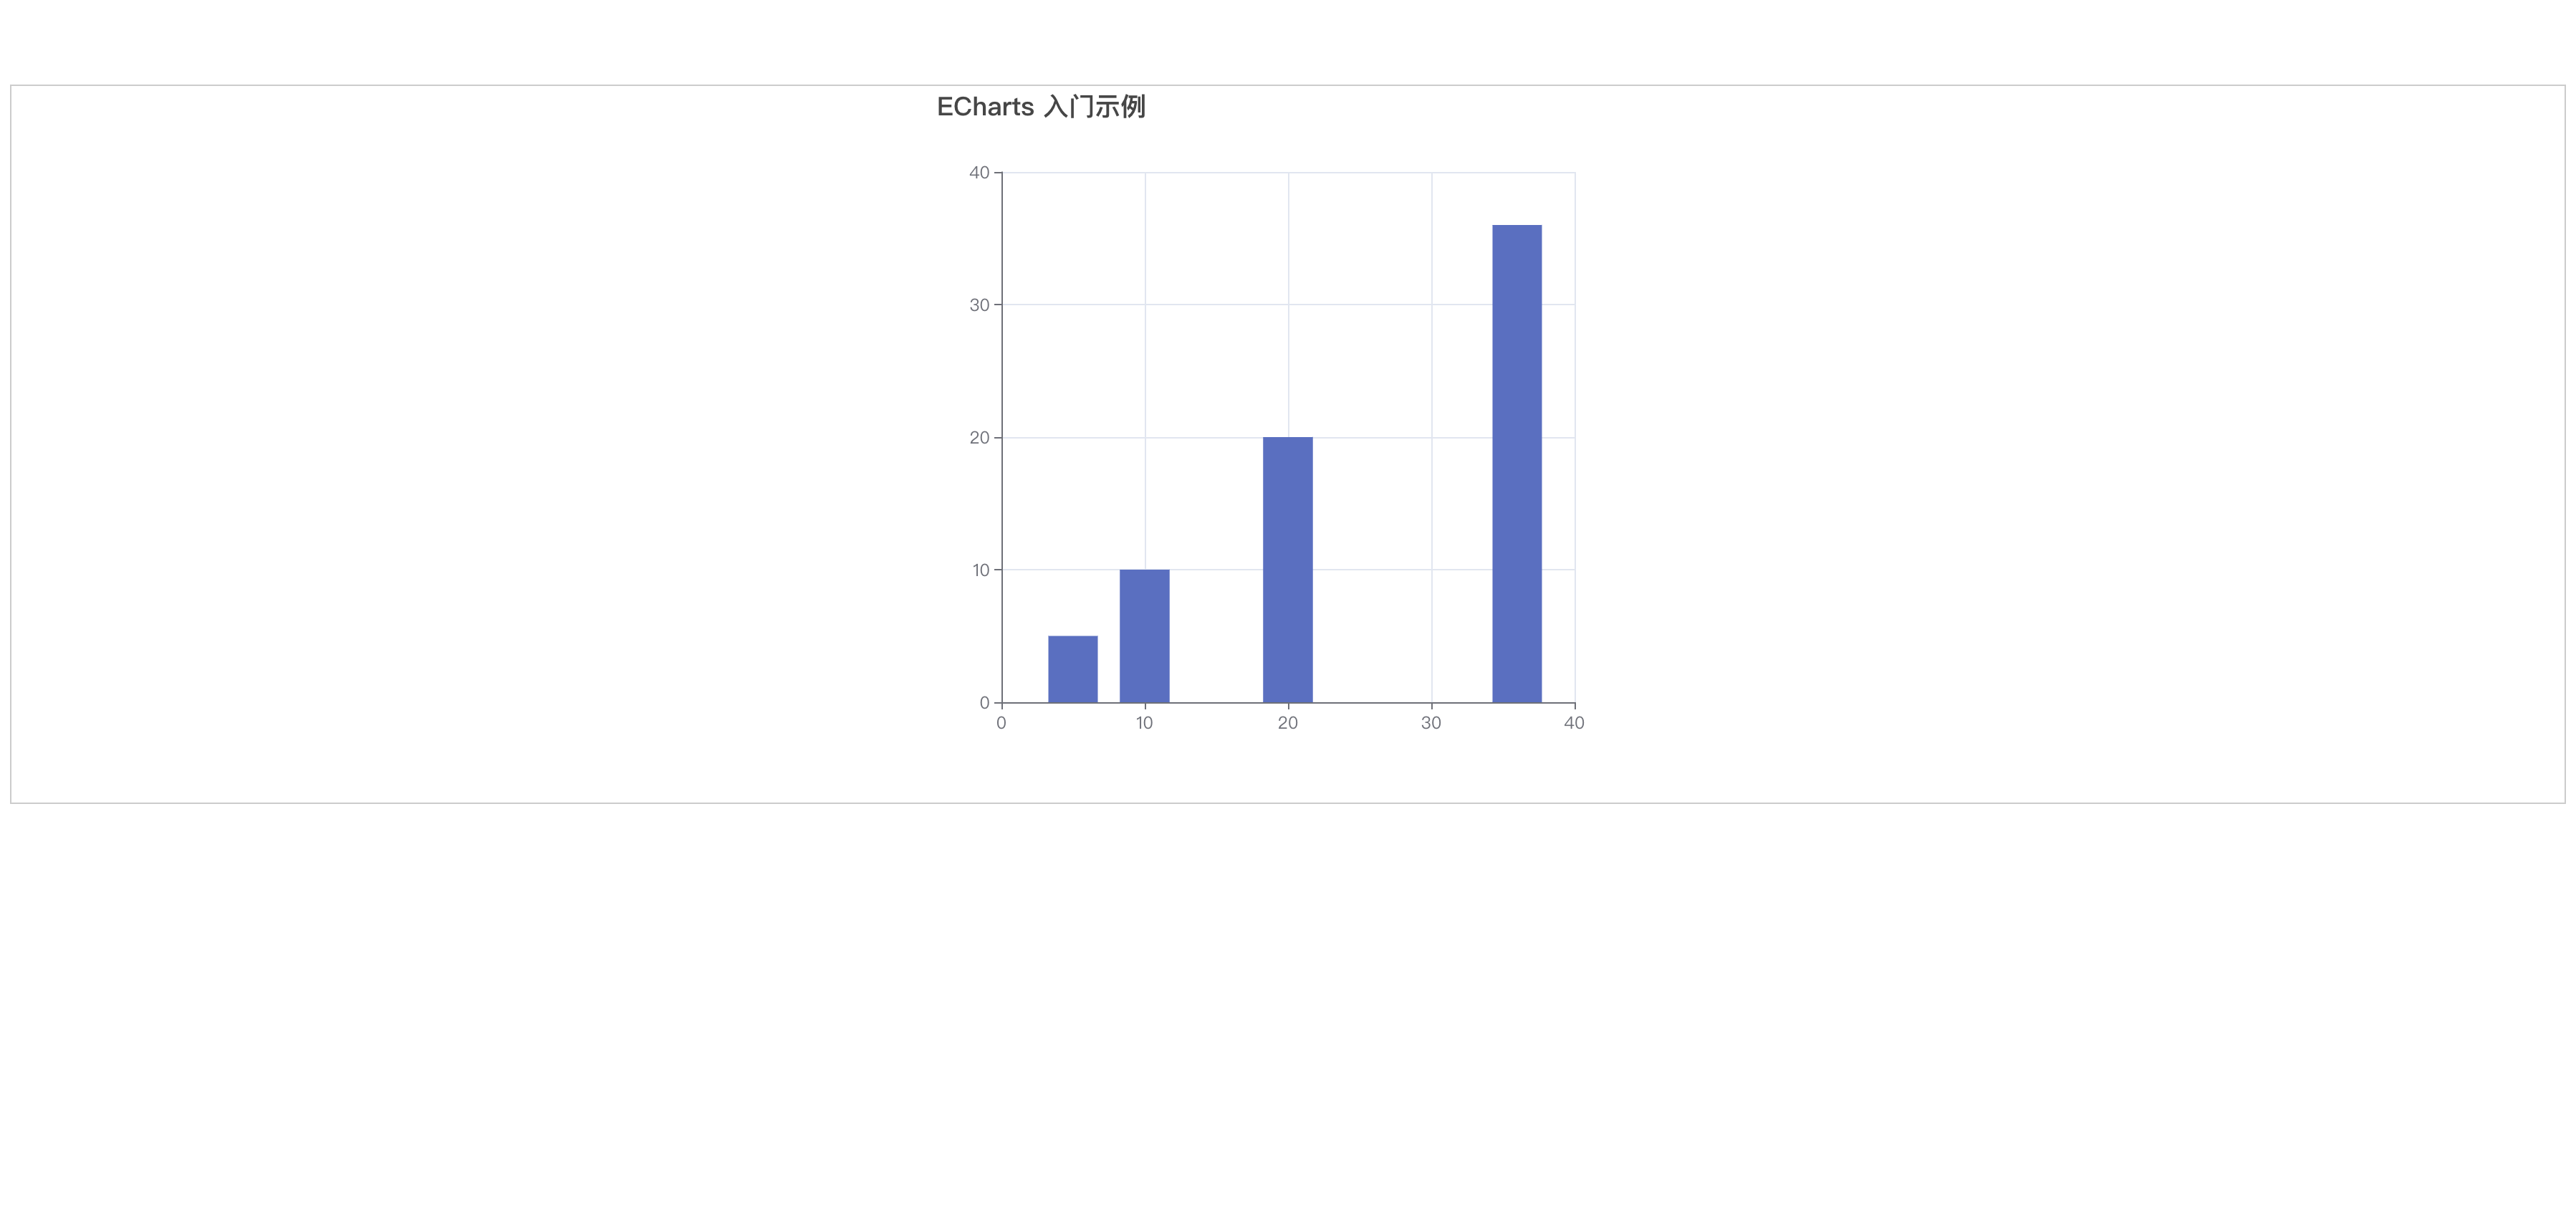
配置完后,我们就可以
npm run serve运行项目来看效果了!
Echarts相关配置
| 属性 | 描述 | 格式 |
|---|---|---|
title |
图表标题相关配置 | {} |
xAxis |
直角坐标系中的 x 轴 | {} |
yAxis |
直角坐标系中的 y 轴 | {} |
series |
数据列表, 可通过 type 属性来定义图表类型 柱状图 线形图 饼图! |
[] |
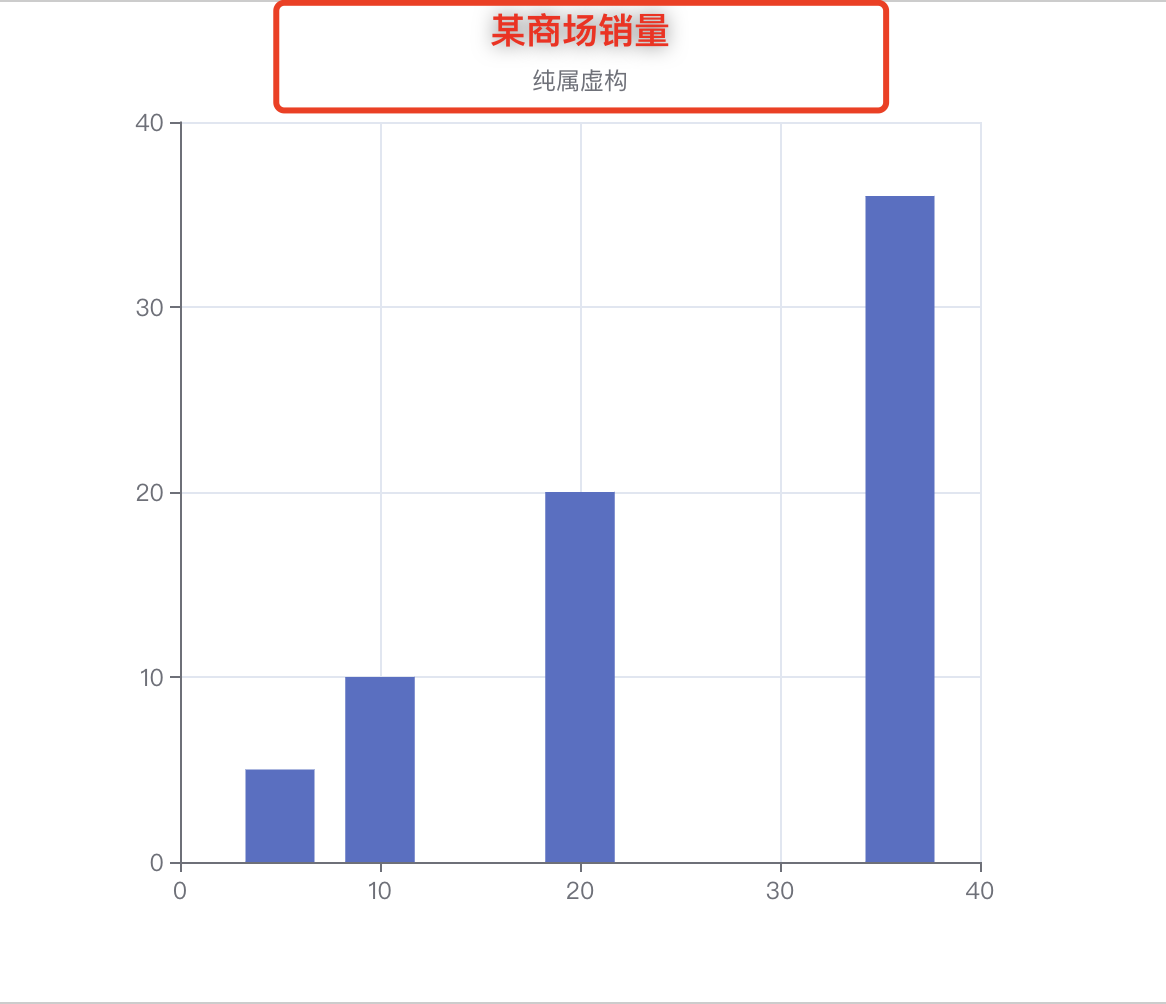
title 图表标题
title是图表标题,以下属性,可以对标题,设置字体风格,大小,加粗,字体,字体颜色,字体行高等,也可以通过subtext来设置文本子标题!具体可参考文档相关配置!
| 属性 | 描述 | 格式 | 可选值or属性 |
|---|---|---|---|
text |
主标题文本,支持使用 \n 换行。 |
string |
|
link |
主标题文本超链接。 | string |
|
target |
指定窗口打开主标题超链接。 | string |
self 当前窗口打开, blank 新窗口打开 |
textStyle |
设置标题字体风格颜色,字体等 | {} |
color/ fontWeight / fontStyle |
subtext |
设置子标题文本 |
string |
title: {
    text: "某商场销量",
    subtext: "纯属虚构",
    //   top: "5", // 距离顶部的距离
    left: "center", // 距离左边的距离
    //   textAlign: "right", // 标题位置
    textStyle: {
      color: "red",
      fontSize: 18,
      fontWeigt: "bold",
      textShadowColor: "rgba(0,0,0,0.5)",
      textShadowBlur: 10,
    },
}
xAxis x 轴
x轴配置相关文档!
直角坐标系
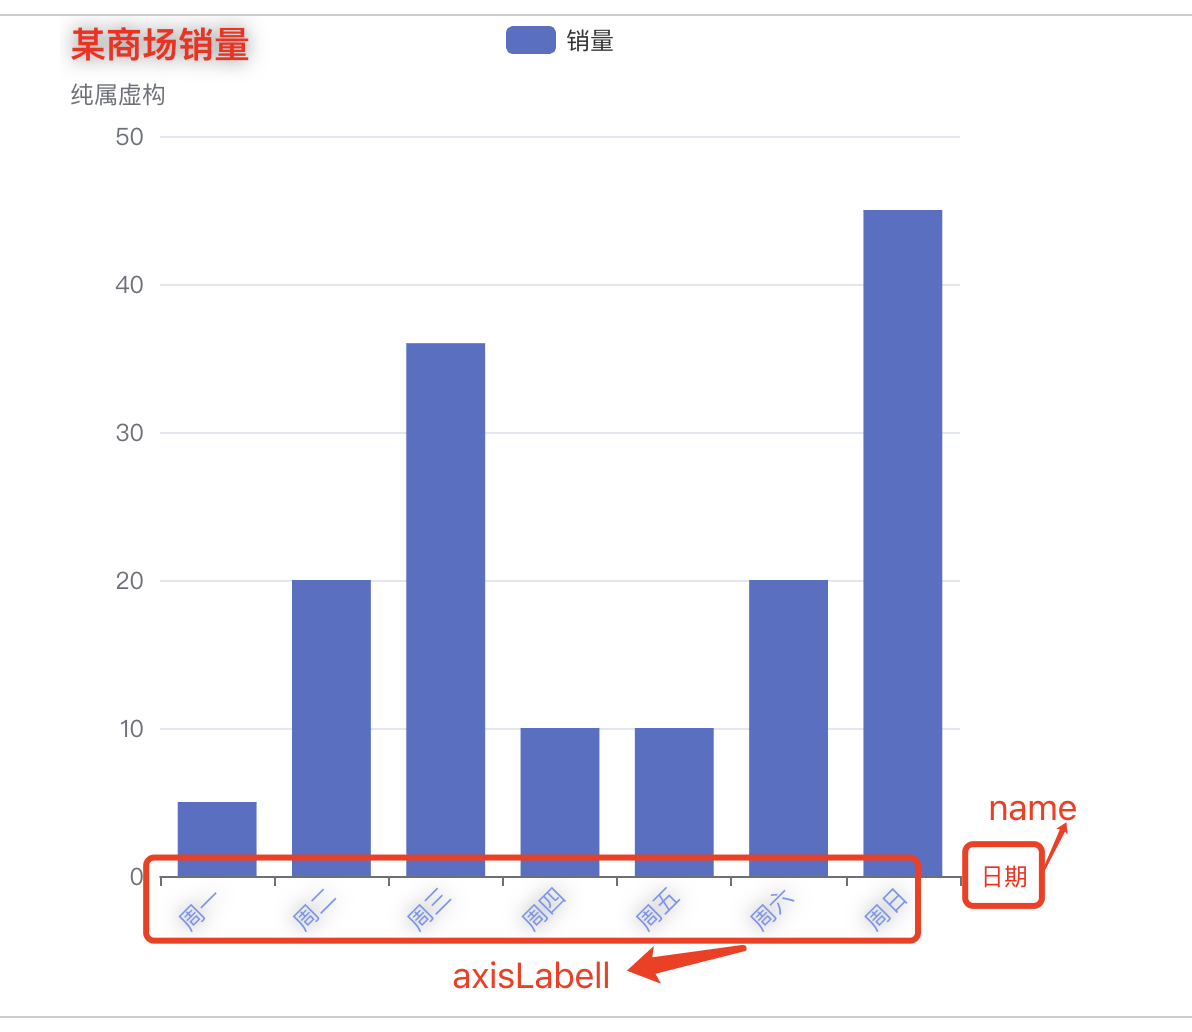
grid中的x 轴,一般情况下单个grid 组件最多只能放上下两个 x 轴,多于两个 x 轴需要通过配置 offset 属性防止同个位置多个 x 轴的重叠。
| 属性 | 描述 | 格式 | 可选值or属性 |
|---|---|---|---|
name |
坐标轴名称。 | string |
|
nameLocation |
坐标轴名称显示位置。 | string |
start/ middle/ end |
nameTextStyle |
坐标轴名称字体风格样式。 | {} |
|
data |
类别轴特有的属性,用来定义类目数据的数组。 | [] |
|
axisLable |
坐标轴刻度标签的配置,可以设置标签的样式、旋转角度等。 | {} |
xAxis 相关配置具体可查看文档!
xAxis: {
  name: "日期", // x轴名称
  nameLocation: "end", // x轴名称位置 start/middle/end
  nameGap: 10, // x轴名称与轴线之间的距离
  nameTextStyle: {
    color: "red",
    fontSize: 12,
    fontWeigt: "bold",
  },
  position: "bottom",
  type: "category", // x轴类型
  data: ["周一", "周二", "周三", "周四", "周五", "周六", "周日"], // x轴数据
  axisLabel: {
    rotate: 45, // 旋转角度
    color: "#7596f0",
    fontSize: 12,
    fontWeigt: "bold",
    textShadowColor: "rgba(0,0,0,0.5)",
    textShadowBlur: 10,
  }
}
yAxis y 轴
y轴 相关配置文档!
yAxis用于配置 Y 轴的各种属性,与xAxis类似,它允许你对图表的 Y 轴进行详细定制。以下是一些常用的 yAxis 属性配置:
type:指定坐标轴的类型,常用的有:
'category':类别轴,适用于离散的类目数据。'value':数值轴,适用于连续数据。'time':时间轴,适用于时间序列数据。'log':对数轴,适用于对数数据。
name:坐标轴的名称,用于显示在图表中。
splitLine:坐标轴刻度线的分割线配置,可以设置其样式。
axisLabel:坐标轴刻度标签的配置,可以设置标签的样式、旋转角度等。
axisTick:坐标轴刻度的配置,可以设置刻度的长度、间隔等。
min 和 max:设置坐标轴的范围,适用于数值轴和时间轴。
boundaryGap:仅在
type为'category'时有效,用来设置类目轴的刻度与类目数据对齐,还是与刻度之间的间隔对齐。axisPointer:坐标轴指示器的配置,例如显示当前点的值。
splitNumber:自动计算刻度分割的段数,适用于数值轴。
minInterval 和 maxInterval:设置数值轴的最小和最大间隔,适用于数值轴。
inverse:设置坐标轴是否反向显示。
triggerEvent:设置坐标轴的刻度变化和文字改变是否触发事件。
position:设置 Y 轴的位置,可以是
'left'或'right'。offset:设置 Y 轴标签与坐标轴的距离。
nameLocation:设置 Y 轴名称的位置,可以是
'start'、'middle'或'end'。
yAxis 相关配置请查看查看有关详细文档!
yAxis: {
  axisLabel: {
    formatter: "{value} 件", // y轴标签格式化
    color: "#7596f0",
    fontSize: 12,
    fontWeigt: "bold",
    textShadowColor: "rgba(0,0,0,0.5)",
    textShadowBlur: 10,
  },
  splitLine: {
    show: true, // 是否显示分割线
    lineStyle: {
      color: "#ccc", // 分割线颜色
      type: "solid", // 分割线类型
    },
  },
}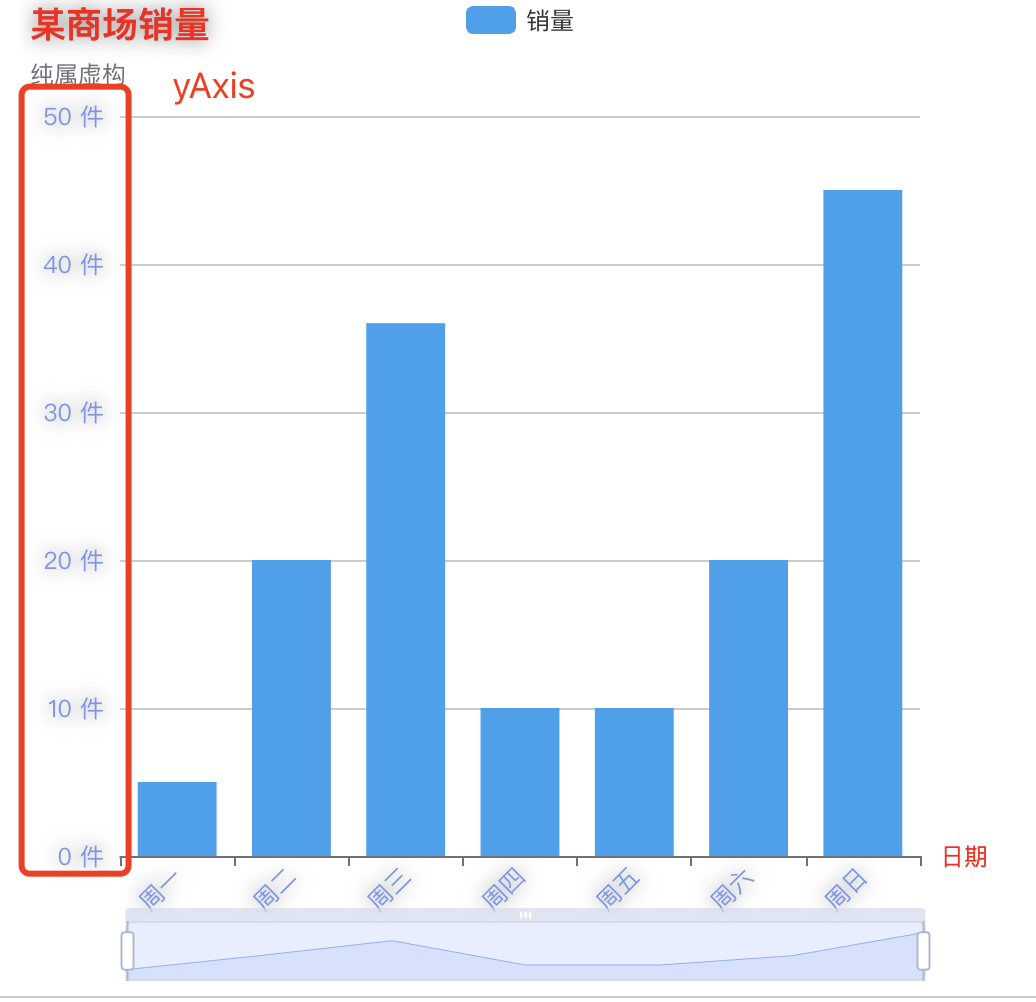
下面的滚动条是通过dataZoom属性来配置的
dataZoom: [
  {
    type: "slider", // 滑动条
    start: 0, // 开始位置
    end: 100, // 结束位置
    show: true, // 是否显示
  },
  {
    type: "inside", // 内置
    start: 0, // 开始位置
    end: 100, // 结束位置
    show: true, // 是否显示
  },
]
series 系列图表数据
series是用来定义图表数据和相关配置的数组,每个元素代表一个系列的数据和配置。以下是一些常用的series属性配置:
series 详细配置在此点击链接查看官方即可!
type:指定系列的类型,如:'line':折线图。'bar':柱状图。'pie':饼图。'scatter':散点图。'boxplot':箱形图。'map':地图。'effectScatter':带有涟漪特效的散点图。'heatmap':热力图。等等。
name:系列名称,用于显示在图例中。data:系列中的数据数组。markPoint:标记点配置,用于标记特殊的数据点。markLine:标记线配置,用于标记特殊的数据线。label:数据标签的配置,用于显示数据的文本信息。itemStyle:系列中图形的样式配置,如颜色、边框等。lineStyle:折线图中线的样式配置。areaStyle:区域填充样式配置,适用于折线图、面积图等。emphasis:鼠标悬停时的高亮样式配置。stack:数据堆叠,用于将多个系列堆叠在一起显示。dimensions:在使用多维数据时,定义数据的维度。encode:在使用多维数据时,定义数据的编码方式。zlevel:系列的分层,用于控制渲染顺序。z:系列的 z 轴值,用于控制同一分层内的渲染顺序。
scheduler:用于配置数据的动态更新。roam:是否允许缩放和平移。smooth:是否启用平滑曲线。symbolSize:散点图中点的大小。itemStyle:系列中图形的样式配置,如颜色、边框等。tooltip:提示框组件的配置,用于显示数据提示。select:用于配置系列的选中状态。showSymbol:是否显示图形的标记。
series: [
    {
      name: "销量",
      type: "bar",
      data: [5, 20, 36, 10, 10, 20],
    },
]
基本配置 背景 和 名称标题name
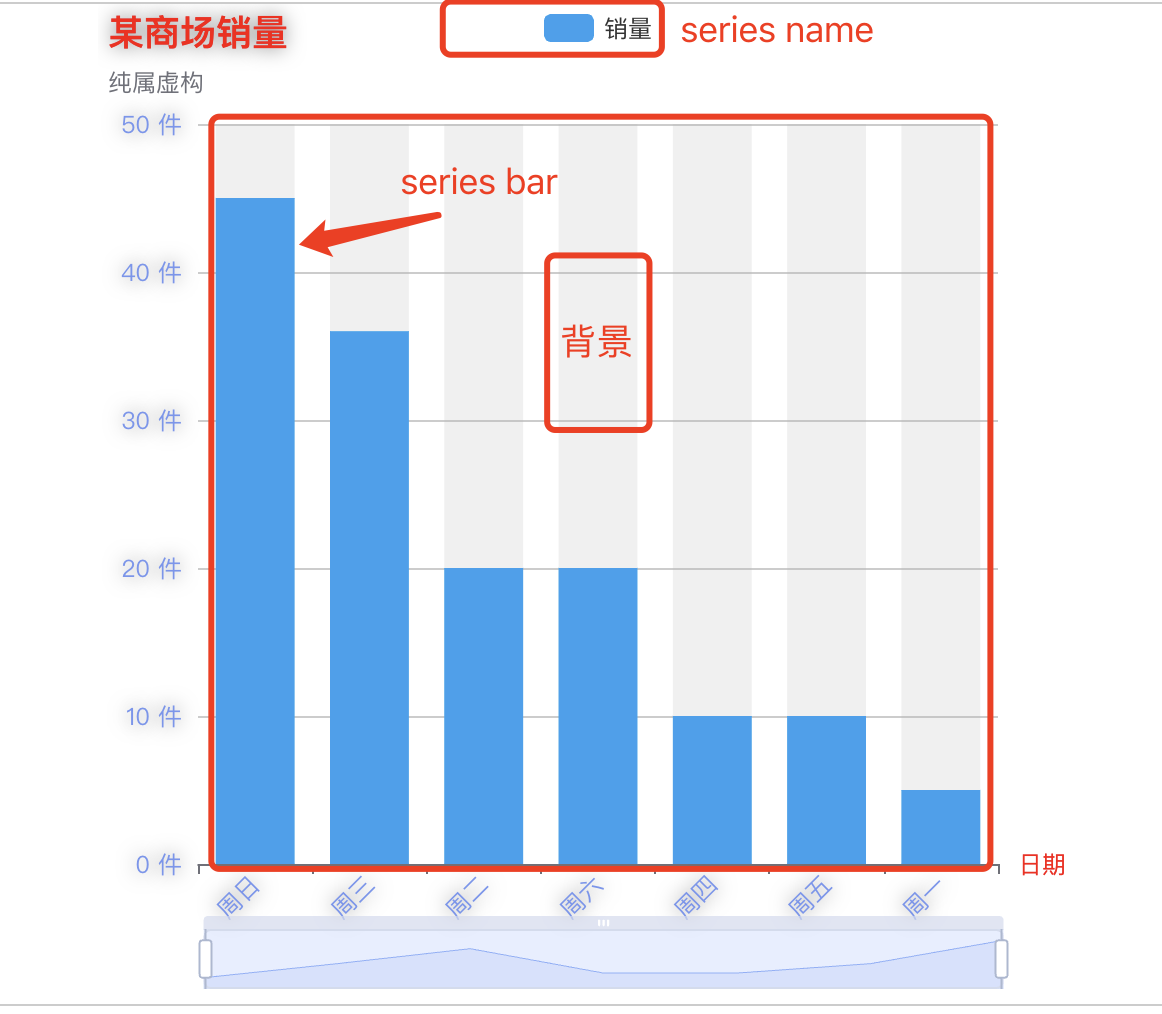
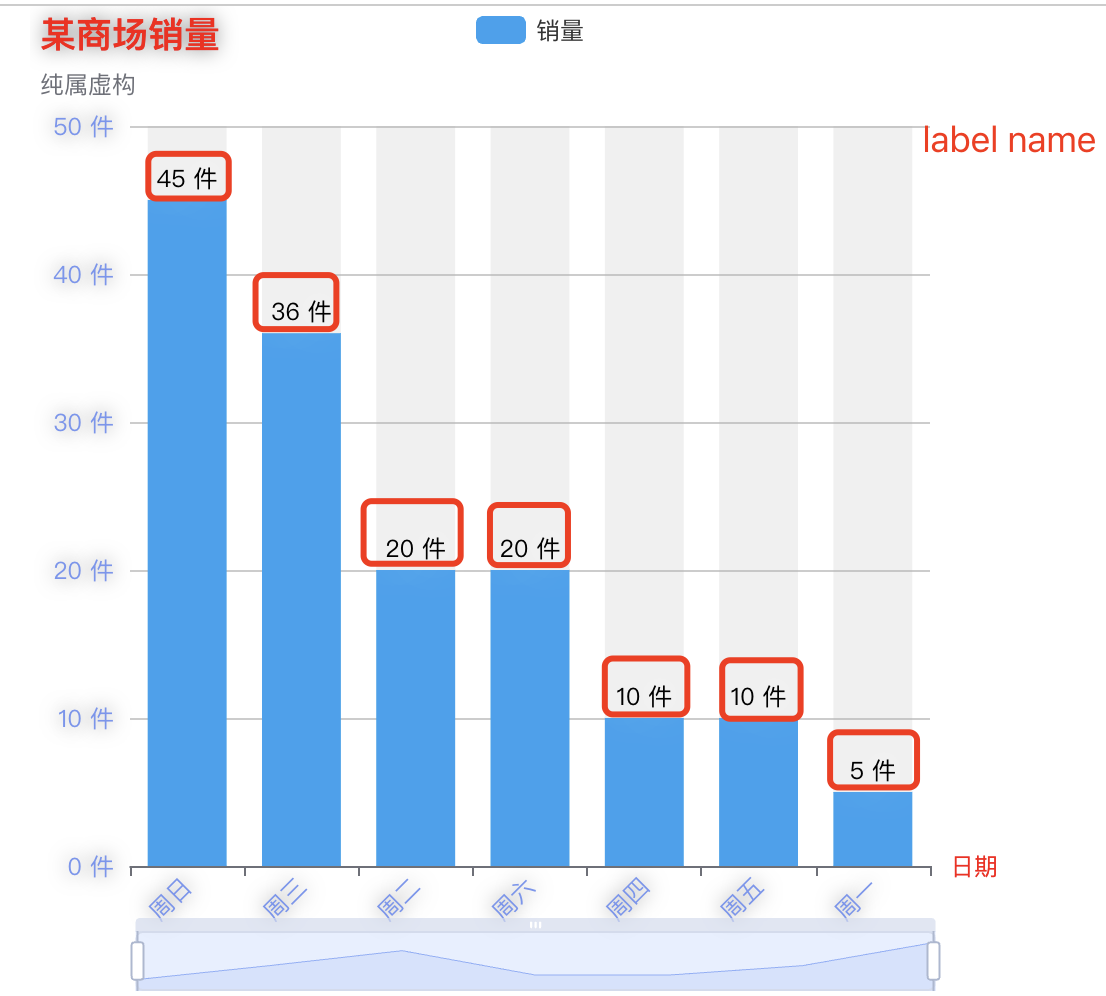
label 标签样式
label 相关配置文档
标签用于显示每个柱状图所表示的
值!
series: [
  {
    name: "销量",
    type: "bar", // 图表类型
    // barWidth: "30", // 柱子宽度 默认自适应
    data: [5, 20, 36, 10, 10, 20, 45],
    showBackground: true, // 是否显示背景
    realtimeSort: true, // 实时排序
    // 标签name样式
     label: {
      show: true, // 是否显示标签
      position: "top", // 标签位置
      color: "#000", // 标签颜色
      fontSize: 12, // 标签字体大小
      fontWeigt: "bold", // 标签字体粗细
      formatter: "{c} 件", // 标签格式化
      textShadowColor : "rgba(255,255,255,0.9)",
      textShadowBlur : 20,
    }
  }
]
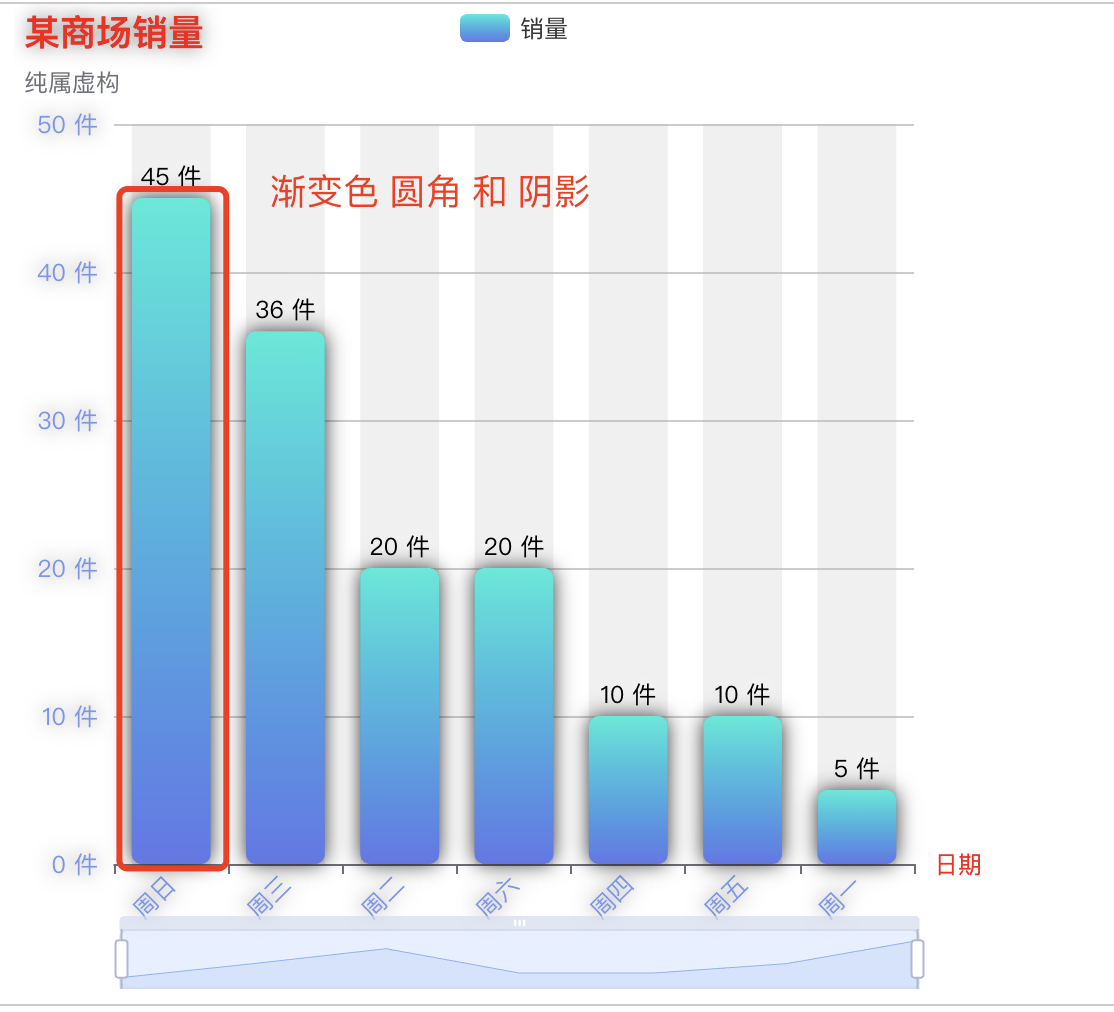
itemStyle 图表项样式
itemStyle 配置文档
用于设置`图表样式`,例如
柱状图,可以设置柱状图,颜色 圆角 阴影等。
series: [
    {
      name: "销量",
      type: "bar", // 图表类型
      // barWidth: "30", // 柱子宽度 默认自适应
      data: [5, 20, 36, 10, 10, 20, 45],
      showBackground: true, // 是否显示背景
      realtimeSort: true, // 实时排序
      // 标签name样式
      label: {
        show: true, // 是否显示标签
        position: "top", // 标签位置
        color: "#000", // 标签颜色
        fontSize: 12, // 标签字体大小
        fontWeigt: "bold", // 标签字体粗细
        formatter: "{c} 件", // 标签格式化
        textShadowColor: "rgba(255,255,255,0.9)",
        textShadowBlur: 20,
      },
      // 柱状图样式 颜色,圆角,阴影
      itemStyle: {
        // color: "#24a2f0", // 图形颜色
        color: {
          type: "linear",
          x: 0,
          y: 0,
          x2: 0,
          y2: 1,
          colorStops: [
            {
              offset: 0,
              color: "#17ead9", // 渐变起始颜色
            },
            {
              offset: 1,
              color: "#6078ea", // 渐变结束颜色
            },
          ],
        },
        barBorderRadius: 5, // 图形圆角
        shadowColor: "rgba(0, 0, 0, 0.8)",
        shadowBlur: 10,
      },
    }
]
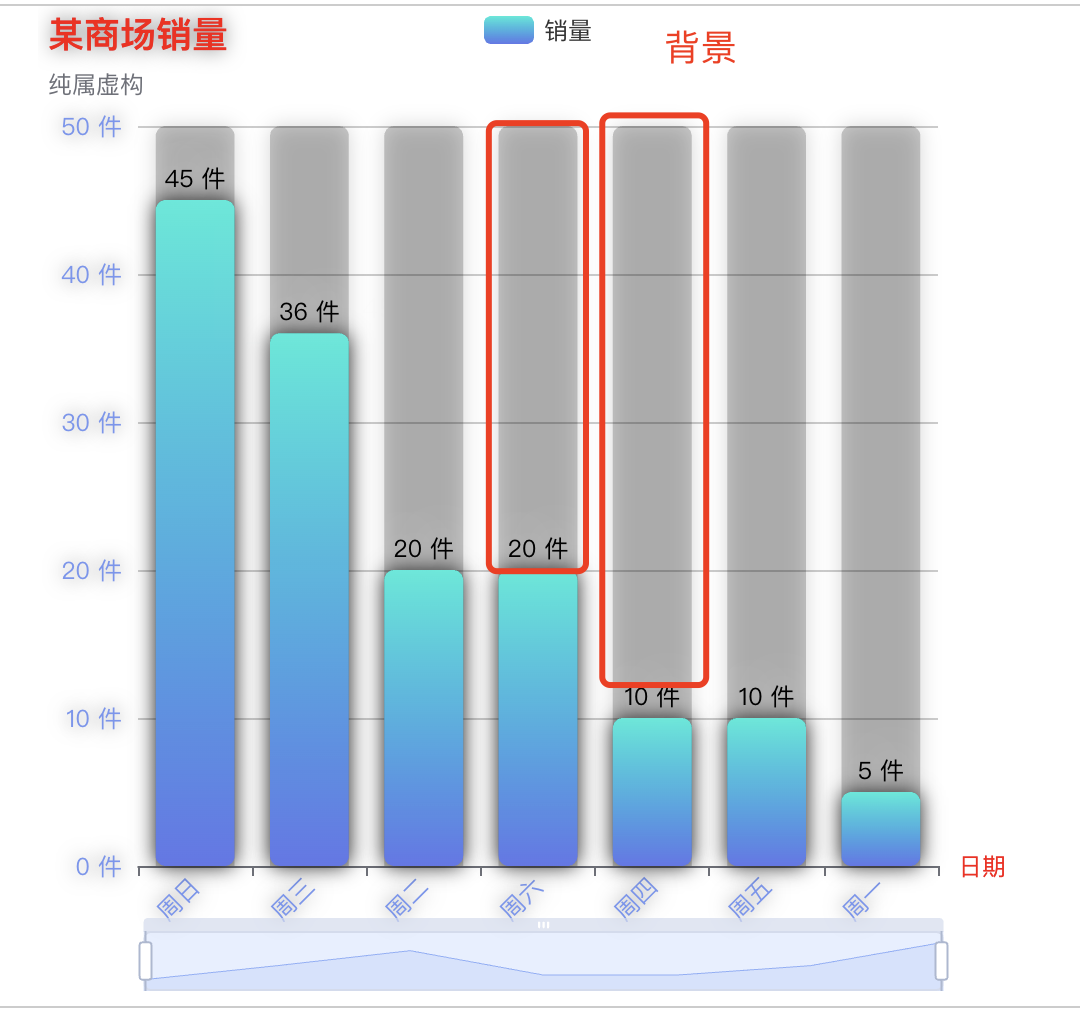
background 背景样式
backgrond 背景样式相关配置文档
可以给图表项,添加背景样式,
背景颜色 阴影 圆角等。在
series下,添加如下配置即可!注意: 在配置
background之前需要将showBackground设置为true开启后方可配置!
// 背景样式
backgroundStyle: {
  color: "rgba(0,0,0,0.2)", // 背景颜色
  shadowColor: "rgba(0, 0, 0, 0.8)",
  shadowBlur: 10,
  borderRadius: 5, // 统一设置四个角的圆角大小
  borderRadius: [5, 5, 0, 0], //(顺时针左上,右上,右下,左下)
}
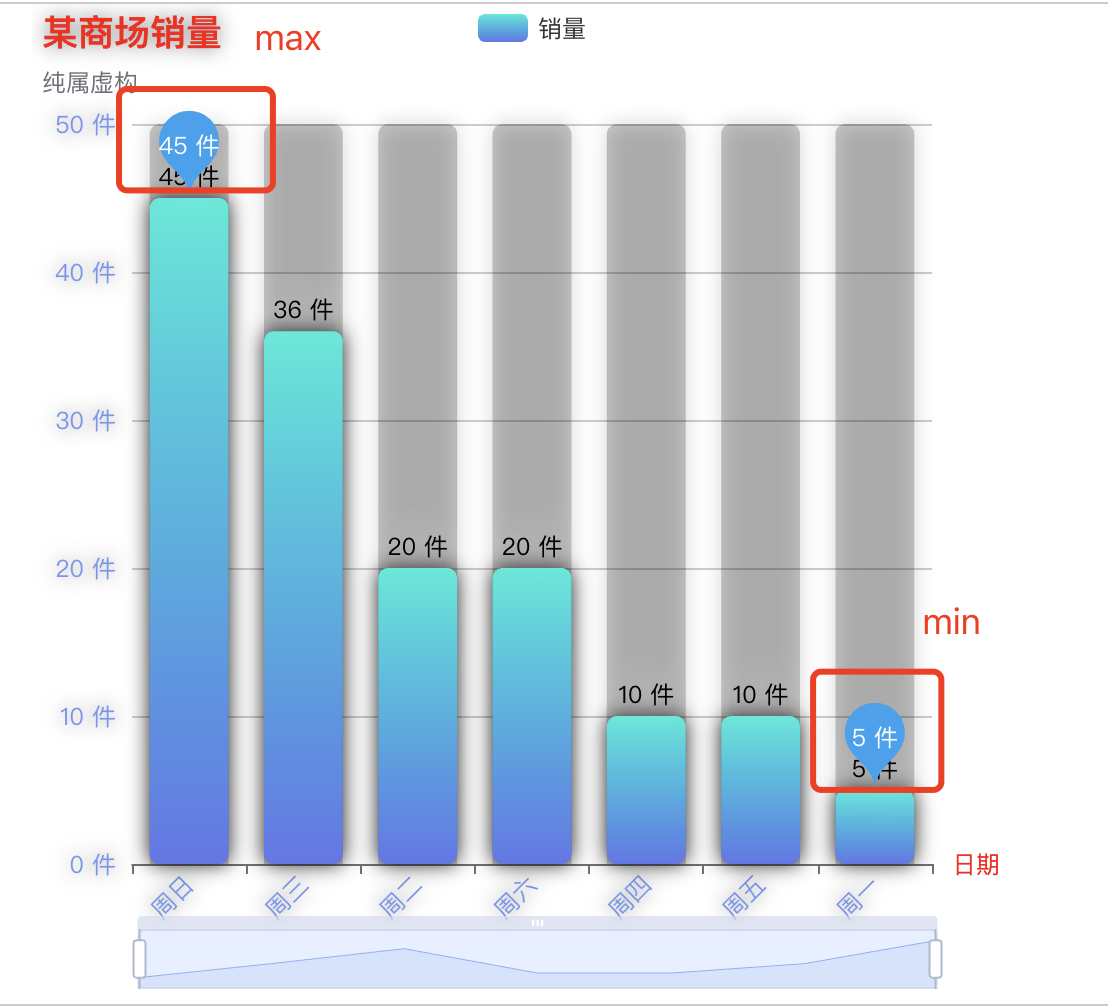
markPoint 图表标注
markPoint相关配置文档
可用于设置
max min average最大值 最小值 和 平均值!
 // 标记点 最大值 最小值
  markPoint: {
    data: [
      {
        type: "max",
        name: "最大值",
        label: {
          show: true,
          position: "inside",
          color: "#fff",
          fontSize: 12,
          fontWeigt: "bold",
          formatter: "{c} 件",
        },
        itemStyle: {
          color: "#24a2f0",
        },
      },
      {
        type: "min",
        name: "最小值",
        label: {
          show: true,
          position: "inside",
          color: "#fff",
          fontSize: 12,
          fontWeigt: "bold",
          formatter: "{c} 件",
        },
        itemStyle: {
          color: "#24a2f0",
        },
      },
    ],
  }
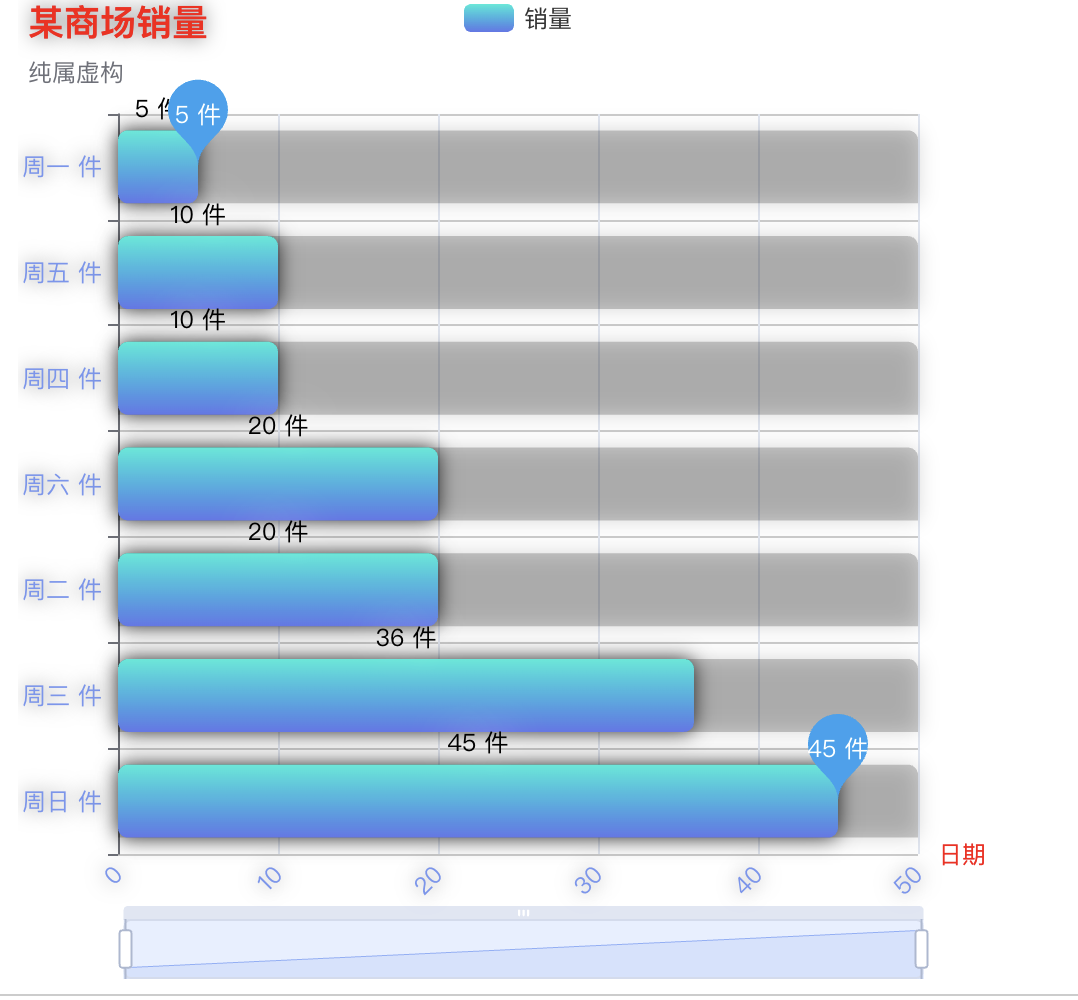
竖轴改变横轴
通过将
y轴以原先为value值,改为类目轴categroy,相反x轴以类目轴categroy改为value值!
{
    title: {
      text: "某商场销量",
      subtext: "纯属虚构",
      //   top: "5", // 距离顶部的距离
      left: "left", // 距离左边的距离
      //   textAlign: "right", // 标题位置
      textStyle: {
        color: "red",
        fontSize: 18,
        fontWeigt: "bold",
        textShadowColor: "rgba(0,0,0,0.5)",
        textShadowBlur: 10,
      },
    },
    tooltip: {},
    legend: {
      data: ["销量"],
    },
    xAxis: {
      name: "日期", // x轴名称
      nameLocation: "end", // x轴名称位置 start/middle/end
      nameGap: 10, // x轴名称与轴线之间的距离
      nameTextStyle: {
        color: "red",
        fontSize: 12,
        fontWeigt: "bold",
      },
      position: "bottom",
      type: "value", // x轴类型
      axisLabel: {
        rotate: 45, // 旋转角度
        color: "#7596f0",
        fontSize: 12,
        fontWeigt: "bold",
        textShadowColor: "rgba(0,0,0,0.5)",
        textShadowBlur: 10,
      },
    },
    yAxis: {
      type: "category",
      data: ["周一", "周二", "周三", "周四", "周五", "周六", "周日"], // x轴数据
      axisLabel: {
        formatter: "{value} 件", // y轴标签格式化
        color: "#7596f0",
        fontSize: 12,
        fontWeigt: "bold",
        textShadowColor: "rgba(0,0,0,0.5)",
        textShadowBlur: 10,
      },
      splitLine: {
        show: true, // 是否显示分割线
        lineStyle: {
          color: "#ccc", // 分割线颜色
          type: "solid", // 分割线类型
        },
      },
    },
}
Echarts通用配置
title 标题
title标题 相关配置文档
标题组件,包含
主标题和副标题。
文字样式
文本样式就是包函了 颜色 字体 加粗等相关样式!
该配置是通过
textStyle来进行相关配置!
{
  title: {
    textStyle: {
      color: "red",
      fontStyle: "normal", // italic // oblique
      fontWeight: "bold", '// normal''bold''bolder''lighter' 100 | 200 | 300 | 400...
      fontSize: 18,
      lineHeight: 15,
      widht: 150,
      height: 45
      textShadowColor: "rgba(255,255,255,0.5)",
      textShadowBlur: 15
    }
  }
}
文字边框
{
  title: {
    borderColor: "red",
    borderRadius: 15,
    borderWidth: 2
  }
}
文字位置
{
  title: {
    top: 15,
    left: 2,
    right: 2,
    bottom: 2
  }
}
tooltip 提示
提示框组件。配置鼠标滑动,或点击的时候有提示框!
tooltip 提示框组件相关配置文档
触发类型
trigger, 分别有item和axis触发时机
triggerOn,分别有mouseOver和click格式化
formatter,可以通过字符串模版和回调函数进行配置
{
  tooltip: {
    trigger: "item", // axis
    triggerOn: "click", // mouseOver
    // formatter: "{a} 的销售数量是 {c}",
    formatter: function( value ){
      console.log("value")
      return "回调函数"
    }
  }
}formatter的具体使用方式请查看文档:
toolbox 工具按钮
工具栏。内置有
导出图片,数据视图,动态类型切换,数据区域缩放,重置五个工具。
toolbox 相关配置文档
该配置是通过
feature以下几个属性来配置
saveAsImage保存图表为图片!
restore配置项还原!
dataView数据视图工具,可以展现当前图表所用的数据,编辑后可以动态更新。
dataZoom数据区域缩放。目前只支持直角坐标系的缩放。
magicType动态类型切换
brush选框组件的控制按钮。
{
  toolbox: {
    feature: {
      saveAsImage: {},
      restore: {},
      dataView: {}
      dataZoom: {},
      magicType: {},
      brush:{}
    }
  }
}
这样一来就可以看到这些工具按钮了!
feature也可以自定义工具按钮!
各工具配置项。
除了各个内置的工具按钮外,还可以自定义工具按钮。
注意,自定义的工具名字,只能以 my 开头,例如下例中的 myTool1,myTool2:
{
    toolbox: {
        feature: {
            myTool1: {
                show: true,
                title: '自定义扩展方法1',
                icon: 'path://M432.45,595.444c0,2.177-4.661,6.82-11.305,6.82c-6.475,0-11.306-4.567-11.306-6.82s4.852-6.812,11.306-6.812C427.841,588.632,432.452,593.191,432.45,595.444L432.45,595.444z M421.155,589.876c-3.009,0-5.448,2.495-5.448,5.572s2.439,5.572,5.448,5.572c3.01,0,5.449-2.495,5.449-5.572C426.604,592.371,424.165,589.876,421.155,589.876L421.155,589.876z M421.146,591.891c-1.916,0-3.47,1.589-3.47,3.549c0,1.959,1.554,3.548,3.47,3.548s3.469-1.589,3.469-3.548C424.614,593.479,423.062,591.891,421.146,591.891L421.146,591.891zM421.146,591.891',
                onclick: function (){
                    alert('myToolHandler1')
                }
            },
            myTool2: {
                show: true,
                title: '自定义扩展方法',
                icon: 'image://https://echarts.apache.org/zh/images/favicon.png',
                onclick: function (){
                    alert('myToolHandler2')
                }
            }
        }
    }
}
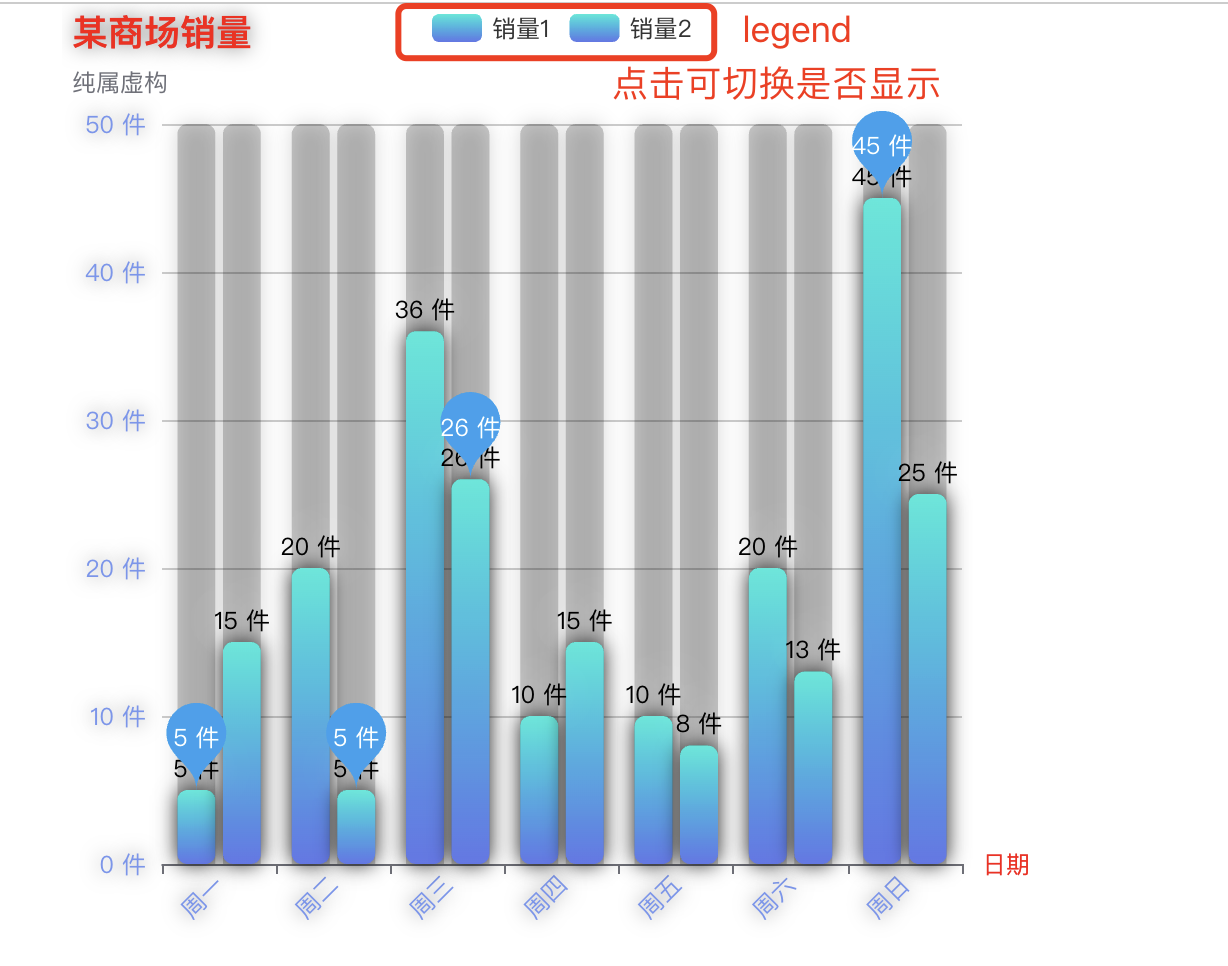
legend 图例
图例组件。在多个系列series中进行数据筛选!
legend 相关配置文档
{
        title: {
          text: "某商场销量",
          subtext: "纯属虚构",
          //   top: "5", // 距离顶部的距离
          left: "left", // 距离左边的距离
          //   textAlign: "right", // 标题位置
          textStyle: {
            color: "red",
            fontSize: 18,
            fontWeigt: "bold",
            textShadowColor: "rgba(0,0,0,0.5)",
            textShadowBlur: 10,
          },
        },
        tooltip: {},
        // legend
        legend: {
          data: ["销量1","销量2"],
        },
        xAxis: {
          type: "category",
          data: ["周一", "周二", "周三", "周四", "周五", "周六", "周日"], // x轴数据
          name: "日期", // x轴名称
          nameLocation: "end", // x轴名称位置 start/middle/end
          nameGap: 10, // x轴名称与轴线之间的距离
          nameTextStyle: {
            color: "red",
            fontSize: 12,
            fontWeigt: "bold",
          },
          position: "bottom",
          axisLabel: {
            rotate: 45, // 旋转角度
            color: "#7596f0",
            fontSize: 12,
            fontWeigt: "bold",
            textShadowColor: "rgba(0,0,0,0.5)",
            textShadowBlur: 10,
          },
        },
        yAxis: {
          type: "value", // x轴类型
          axisLabel: {
            formatter: "{value} 件", // y轴标签格式化
            color: "#7596f0",
            fontSize: 12,
            fontWeigt: "bold",
            textShadowColor: "rgba(0,0,0,0.5)",
            textShadowBlur: 10,
          },
          splitLine: {
            show: true, // 是否显示分割线
            lineStyle: {
              color: "#ccc", // 分割线颜色
              type: "solid", // 分割线类型
            },
          },
        },
        color: "#24a2f0", // 主题颜色
        backgroundColor: "#fff", // 背景颜色
        animation: true, // 关闭动画效果
        series: [
          {
            name: "销量1",
            type: "bar", // 图表类型
            // barWidth: "30", // 柱子宽度 默认自适应
            data: [5, 20, 36, 10, 10, 20, 45],
            showBackground: true, // 是否显示背景
            realtimeSort: false, // 实时排序
            // 标签name样式
            label: {
              show: true, // 是否显示标签
              position: "top", // 标签位置
              color: "#000", // 标签颜色
              fontSize: 12, // 标签字体大小
              fontWeigt: "bold", // 标签字体粗细
              formatter: "{c} 件", // 标签格式化
              textShadowColor: "rgba(255,255,255,0.9)",
              textShadowBlur: 20,
            },
            // 柱状图样式 颜色,圆角,阴影
            itemStyle: {
              // color: "#24a2f0", // 图形颜色
              color: {
                type: "linear",
                x: 0,
                y: 0,
                x2: 0,
                y2: 1,
                colorStops: [
                  {
                    offset: 0,
                    color: "#17ead9", // 渐变起始颜色
                  },
                  {
                    offset: 1,
                    color: "#6078ea", // 渐变结束颜色
                  },
                ],
              },
              barBorderRadius: 5, // 图形圆角
              shadowColor: "rgba(0, 0, 0, 0.8)",
              shadowBlur: 10,
            },
            // 背景样式
            backgroundStyle: {
              color: "rgba(0,0,0,0.2)", // 背景颜色
              shadowColor: "rgba(0, 0, 0, 0.8)",
              shadowBlur: 10,
              borderRadius: 5, // 统一设置四个角的圆角大小
              borderRadius: [5, 5, 0, 0], //(顺时针左上,右上,右下,左下)
            },
            // 标记点 最大值 最小值
            markPoint: {
              data: [
                {
                  type: "max",
                  name: "最大值",
                  label: {
                    show: true,
                    position: "inside",
                    color: "#fff",
                    fontSize: 12,
                    fontWeigt: "bold",
                    formatter: "{c} 件",
                  },
                  itemStyle: {
                    color: "#24a2f0",
                  },
                },
                {
                  type: "min",
                  name: "最小值",
                  label: {
                    show: true,
                    position: "inside",
                    color: "#fff",
                    fontSize: 12,
                    fontWeigt: "bold",
                    formatter: "{c} 件",
                  },
                  itemStyle: {
                    color: "#24a2f0",
                  },
                },
              ],
            }
          },
          {
            name: "销量2",
            type: "bar", // 图表类型
            // barWidth: "30", // 柱子宽度 默认自适应
            data: [15, 5, 26, 15, 8, 13, 25],
            showBackground: true, // 是否显示背景
            realtimeSort: false, // 实时排序
            // 标签name样式
            label: {
              show: true, // 是否显示标签
              position: "top", // 标签位置
              color: "#000", // 标签颜色
              fontSize: 12, // 标签字体大小
              fontWeigt: "bold", // 标签字体粗细
              formatter: "{c} 件", // 标签格式化
              textShadowColor: "rgba(255,255,255,0.9)",
              textShadowBlur: 20,
            },
            // 柱状图样式 颜色,圆角,阴影
            itemStyle: {
              // color: "#24a2f0", // 图形颜色
              color: {
                type: "linear",
                x: 0,
                y: 0,
                x2: 0,
                y2: 1,
                colorStops: [
                  {
                    offset: 0,
                    color: "#17ead9", // 渐变起始颜色
                  },
                  {
                    offset: 1,
                    color: "#6078ea", // 渐变结束颜色
                  },
                ],
              },
              barBorderRadius: 5, // 图形圆角
              shadowColor: "rgba(0, 0, 0, 0.8)",
              shadowBlur: 10,
            },
            // 背景样式
            backgroundStyle: {
              color: "rgba(0,0,0,0.2)", // 背景颜色
              shadowColor: "rgba(0, 0, 0, 0.8)",
              shadowBlur: 10,
              borderRadius: 5, // 统一设置四个角的圆角大小
              borderRadius: [5, 5, 0, 0], //(顺时针左上,右上,右下,左下)
            },
            // 标记点 最大值 最小值
            markPoint: {
              data: [
                {
                  type: "max",
                  name: "最大值",
                  label: {
                    show: true,
                    position: "inside",
                    color: "#fff",
                    fontSize: 12,
                    fontWeigt: "bold",
                    formatter: "{c} 件",
                  },
                  itemStyle: {
                    color: "#24a2f0",
                  },
                },
                {
                  type: "min",
                  name: "最小值",
                  label: {
                    show: true,
                    position: "inside",
                    color: "#fff",
                    fontSize: 12,
                    fontWeigt: "bold",
                    formatter: "{c} 件",
                  },
                  itemStyle: {
                    color: "#24a2f0",
                  },
                },
              ],
            }
          },
        ],
      }
legend: {
data: ["销量1","销量2"],
}
legend中的data与series每个系列中的name属性保持一致!
Echarts常用图表
折线图
折线图是用折线将各个数据点
标志连接起来的图表,用于展现数据的变化趋势。可用于直角坐标系和极坐标系上。
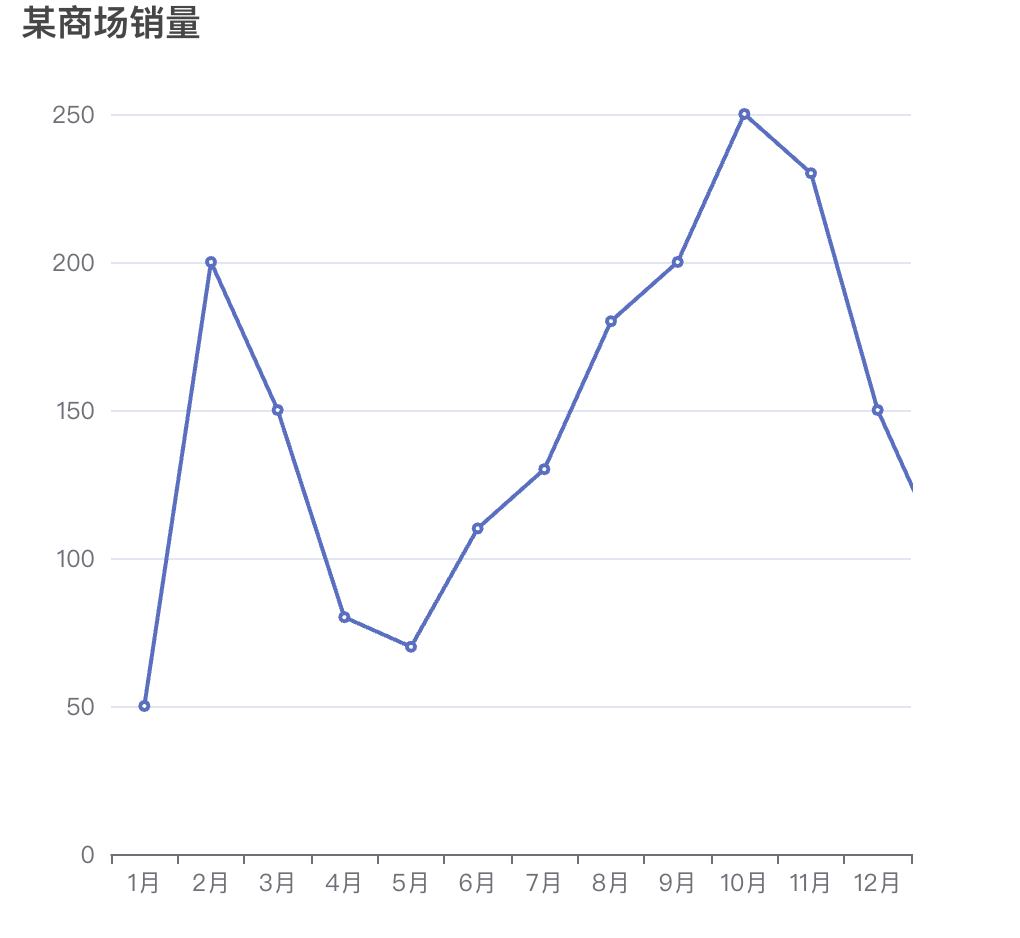
配置项如下,我们只需要把type: "bar" 改为 type: "line"即可!
{
  xAxis: {
    type: "category",
    data: [
      "1月",
      "2月",
      "3月",
      "4月",
      "5月",
      "6月",
      "7月",
      "8月",
      "9月",
      "10月",
      "11月",
      "12月",
    ],
  },
  yAxis: {
    type: "value",
  },
  series: [
    {
      type: "line",
      data: [50, 200, 150, 80, 70, 110, 130, 180, 200, 250, 230, 150, 100]
    }
  ]
}
标记mark
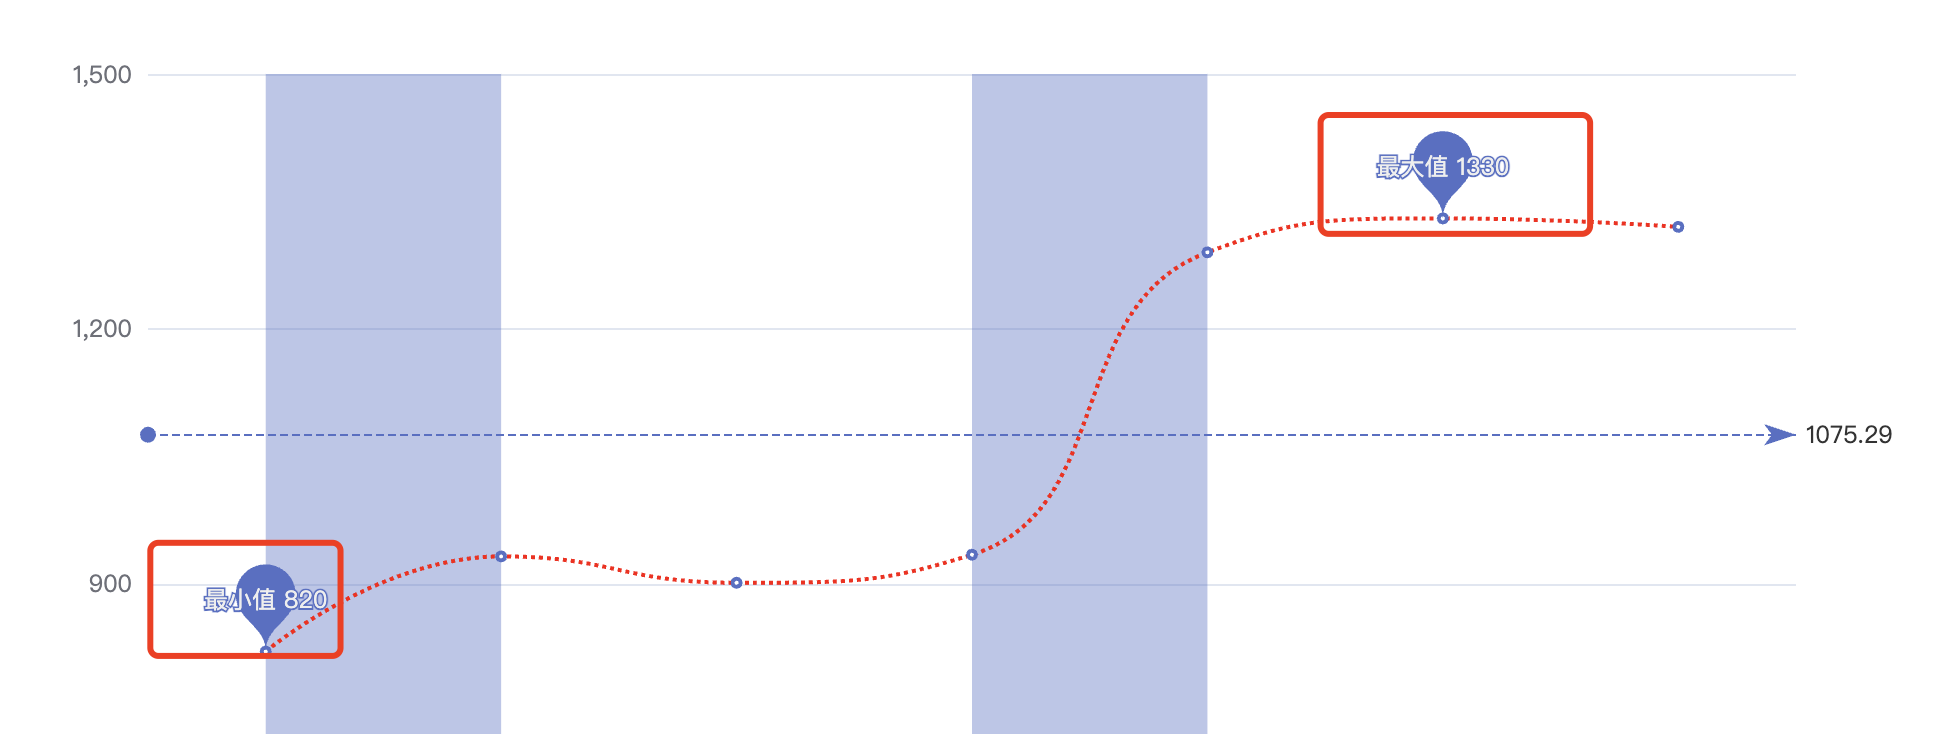
标记可以用来配置,
markPoint最大值 最小值和markLine平均值等,markArea区域可以标注某个系列的具体范围!

配置项如下,mark相关标记配置具体在,series.line或者 series.bar配置当中,不是所有图表都支持此项!
{
  series: [
    {
      type: "line",
      data: [50, 200, 150, 80, 70, 110, 130, 180, 200, 250, 230, 150, 100],
      markPoint: {
        label: {
          show: true,
          formatter: "{b} {c}"
        },
        data: [
          { type: "max", name: "最大值" },
          { type: "min", name: "最小值" }
        ]
      }
    }
  ]
}
label配置项,就是最大值和最小值,所展示的描述标签!data中的name用来配合formatter进行格式化展示!
{b}代表name,而{c}呢代表的是最大值和最小值的数值!
线条样式,以及平滑设置
我们也可以通过
lineStyle来配置,线的样式,例如,实线虚线以及颜色等!
smooth可以让线条折线出变的更加平滑!
lineStyle 配置文档!
{
  series: [
    {
      type: "line",
      data: [50, 200, 150, 80, 70, 110, 130, 180, 200, 250, 230, 150, 100],
      smooth: true,
      lineStyle: {
        color: "red",
        type: "dotted" // solid 实线 dashed 虚线 dotted 点状线
      },
      markPoint: {
        label: {
          show: true,
          formatter: "{b} {c}"
        },
        data: [
          { type: "max", name: "最大值" },
          { type: "min", name: "最小值" }
        ]
      }
    }
  ]
}展示结果,如标记mark 下预览图即可看出效果!
区域风格
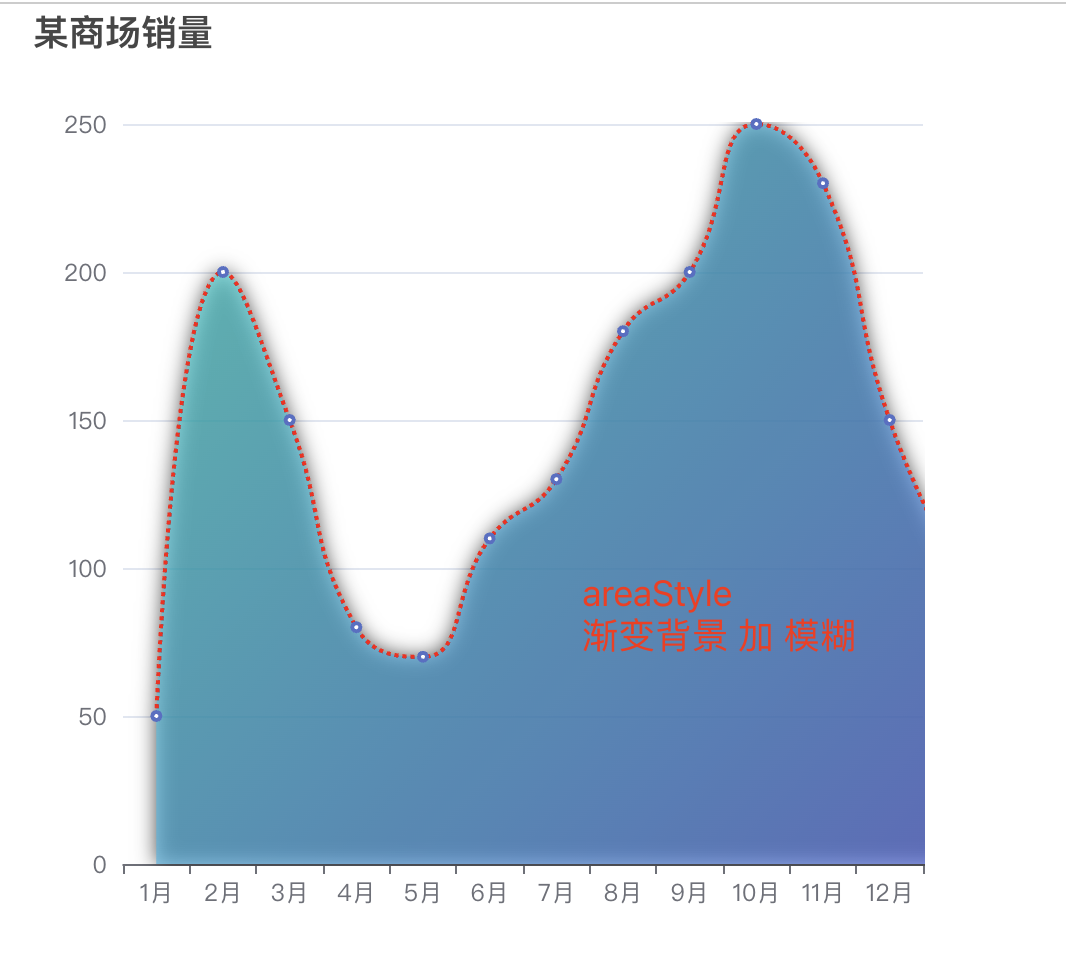
区域风格是通过
areaStyle来实现的,可以实现区域的显示样式,如颜色,阴影!
areaStyle 配置文档!
{
  series: [
    {
      type: "line",
      data: [50, 200, 150, 80, 70, 110, 130, 180, 200, 250, 230, 150, 100],
      smooth: true,
      lineStyle: {
        color: "red",
        type: "dotted" // solid 实线 dashed 虚线 dotted 点状线
      },
      markPoint: {
        label: {
          show: true,
          formatter: "{b} {c}"
        },
        data: [
          { type: "max", name: "最大值" },
          { type: "min", name: "最小值" }
        ]
      }
    }
  ]
}
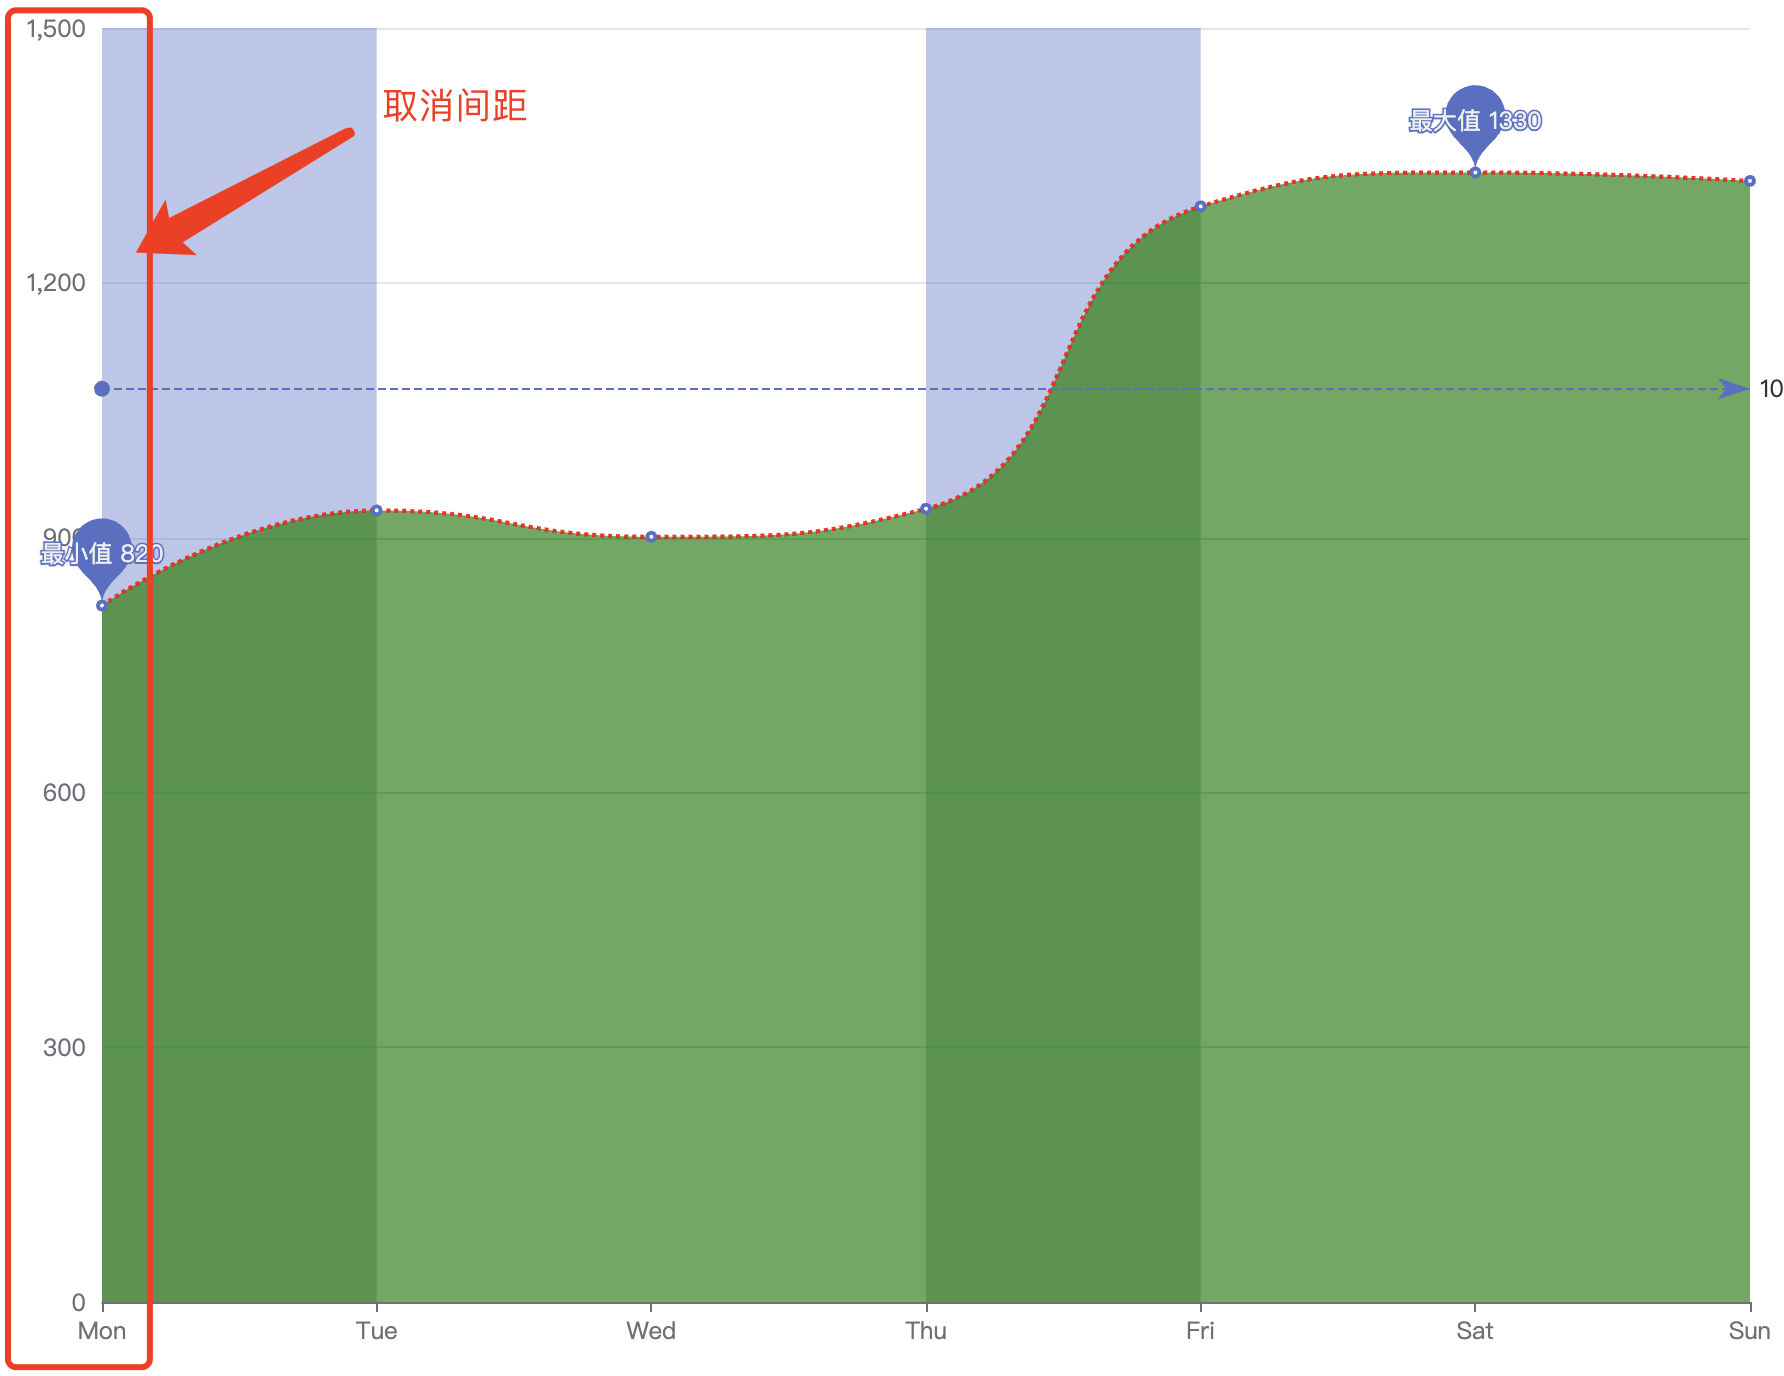
配置x轴到y轴之间的间隔
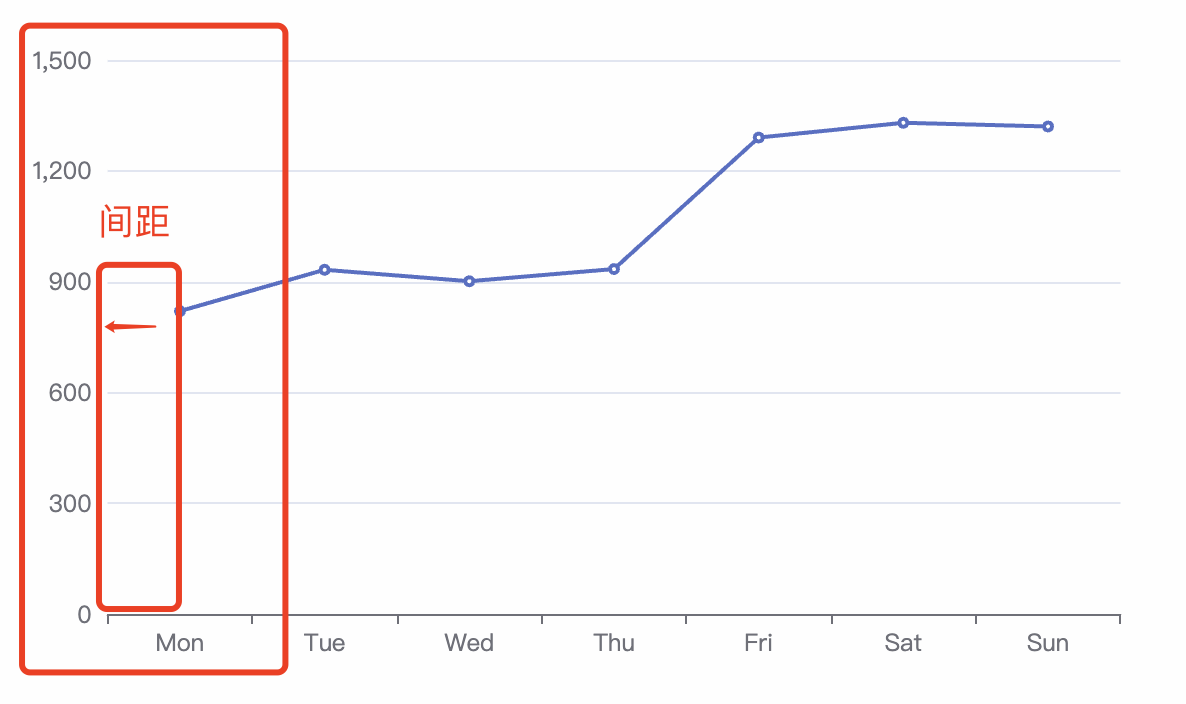
就是
x 开始轴与y 轴之间的间距! 通过在xAxis中配置boundaryGap属性为false即可!
{
  xAxis: {
    type: "categroy",
    data: [],
    boundaryGap: false
  }
}
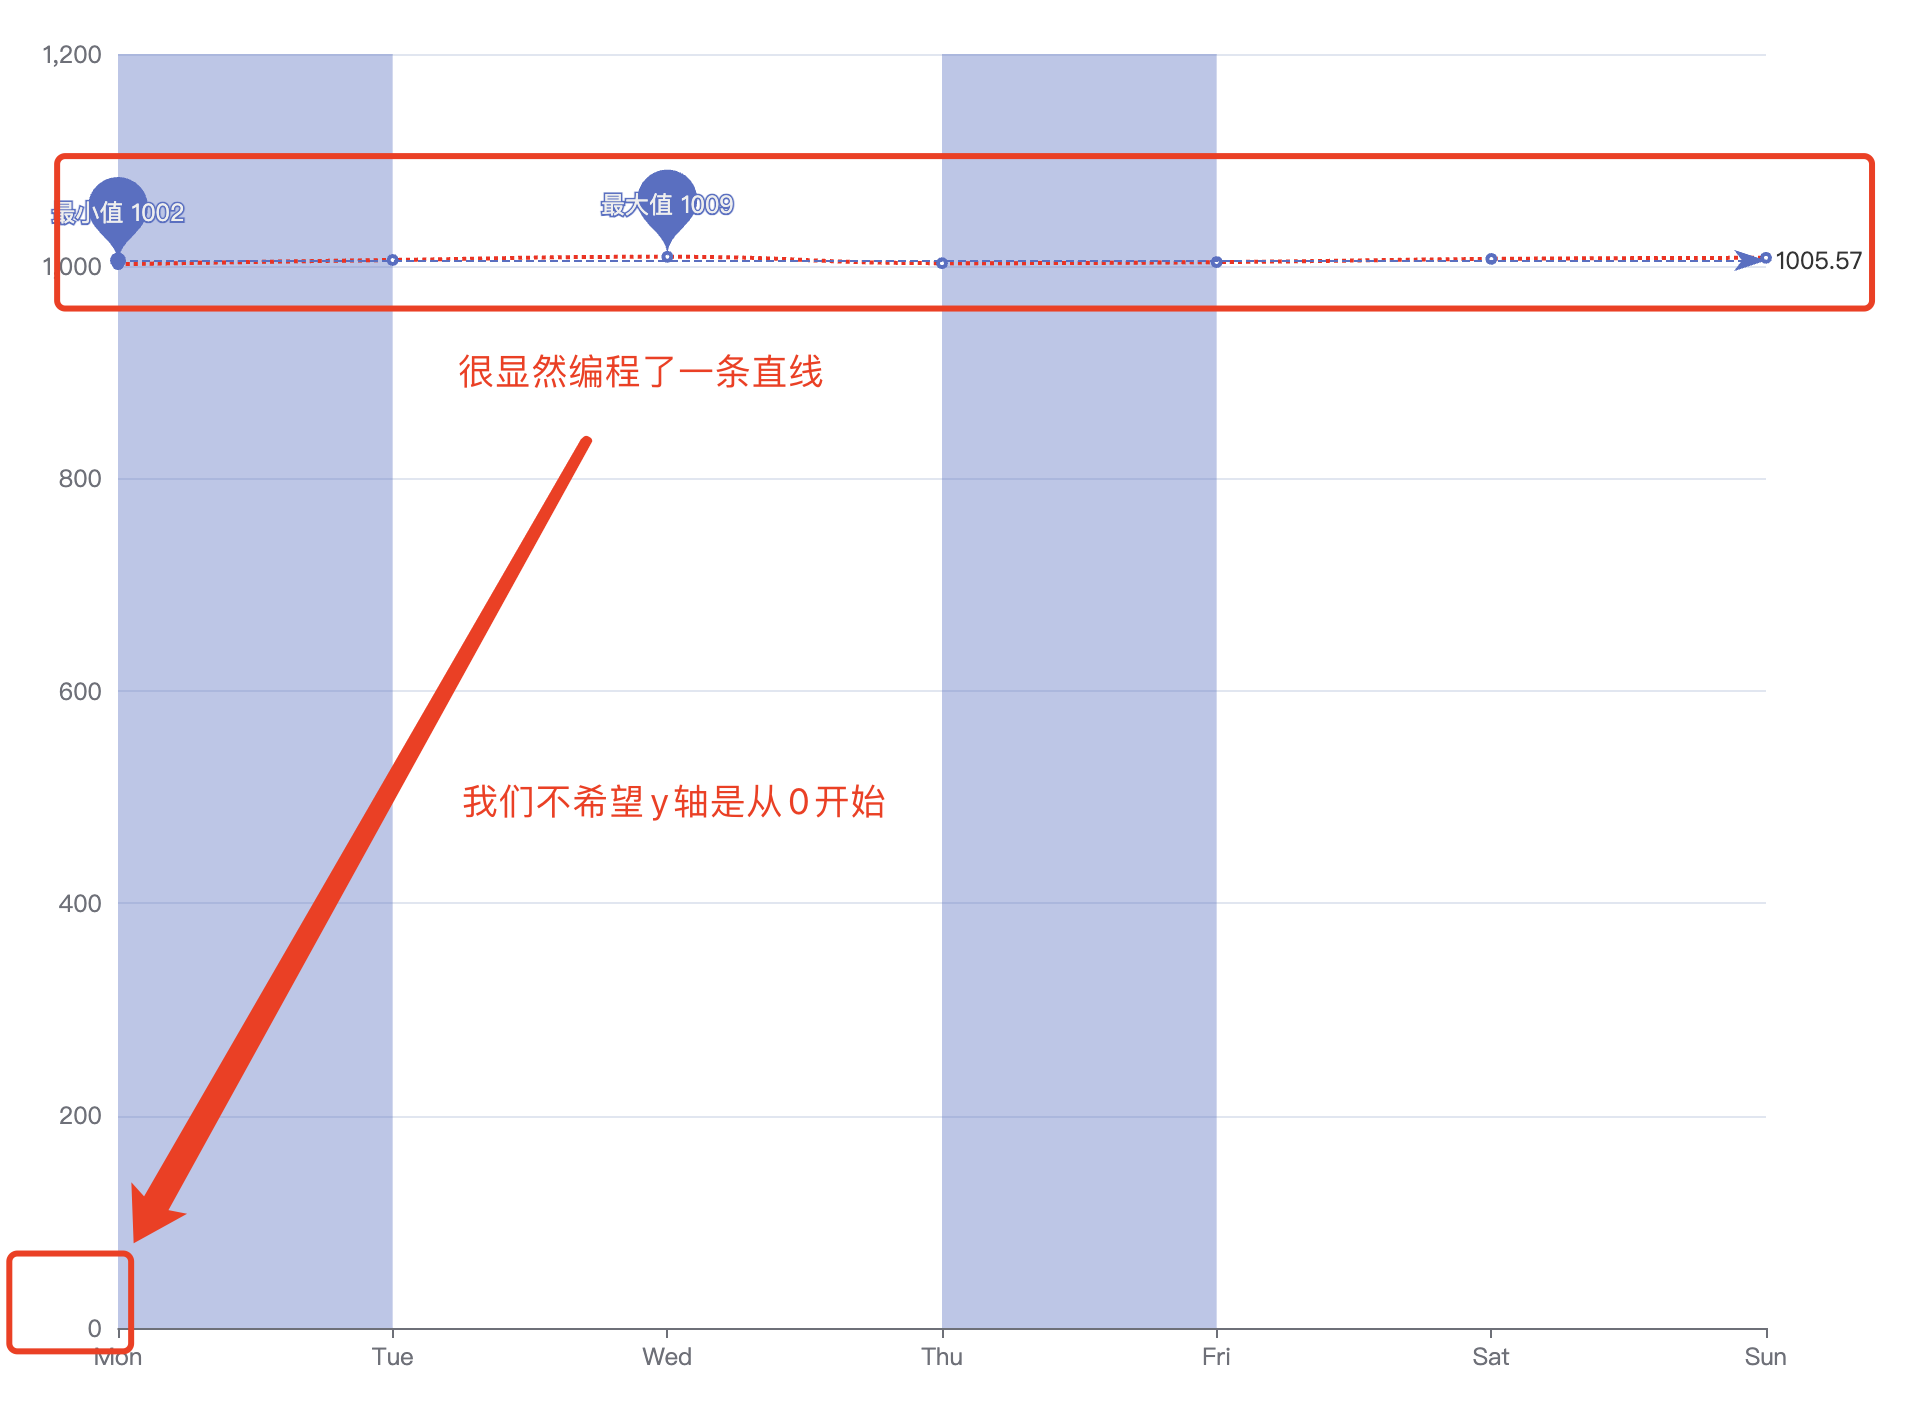
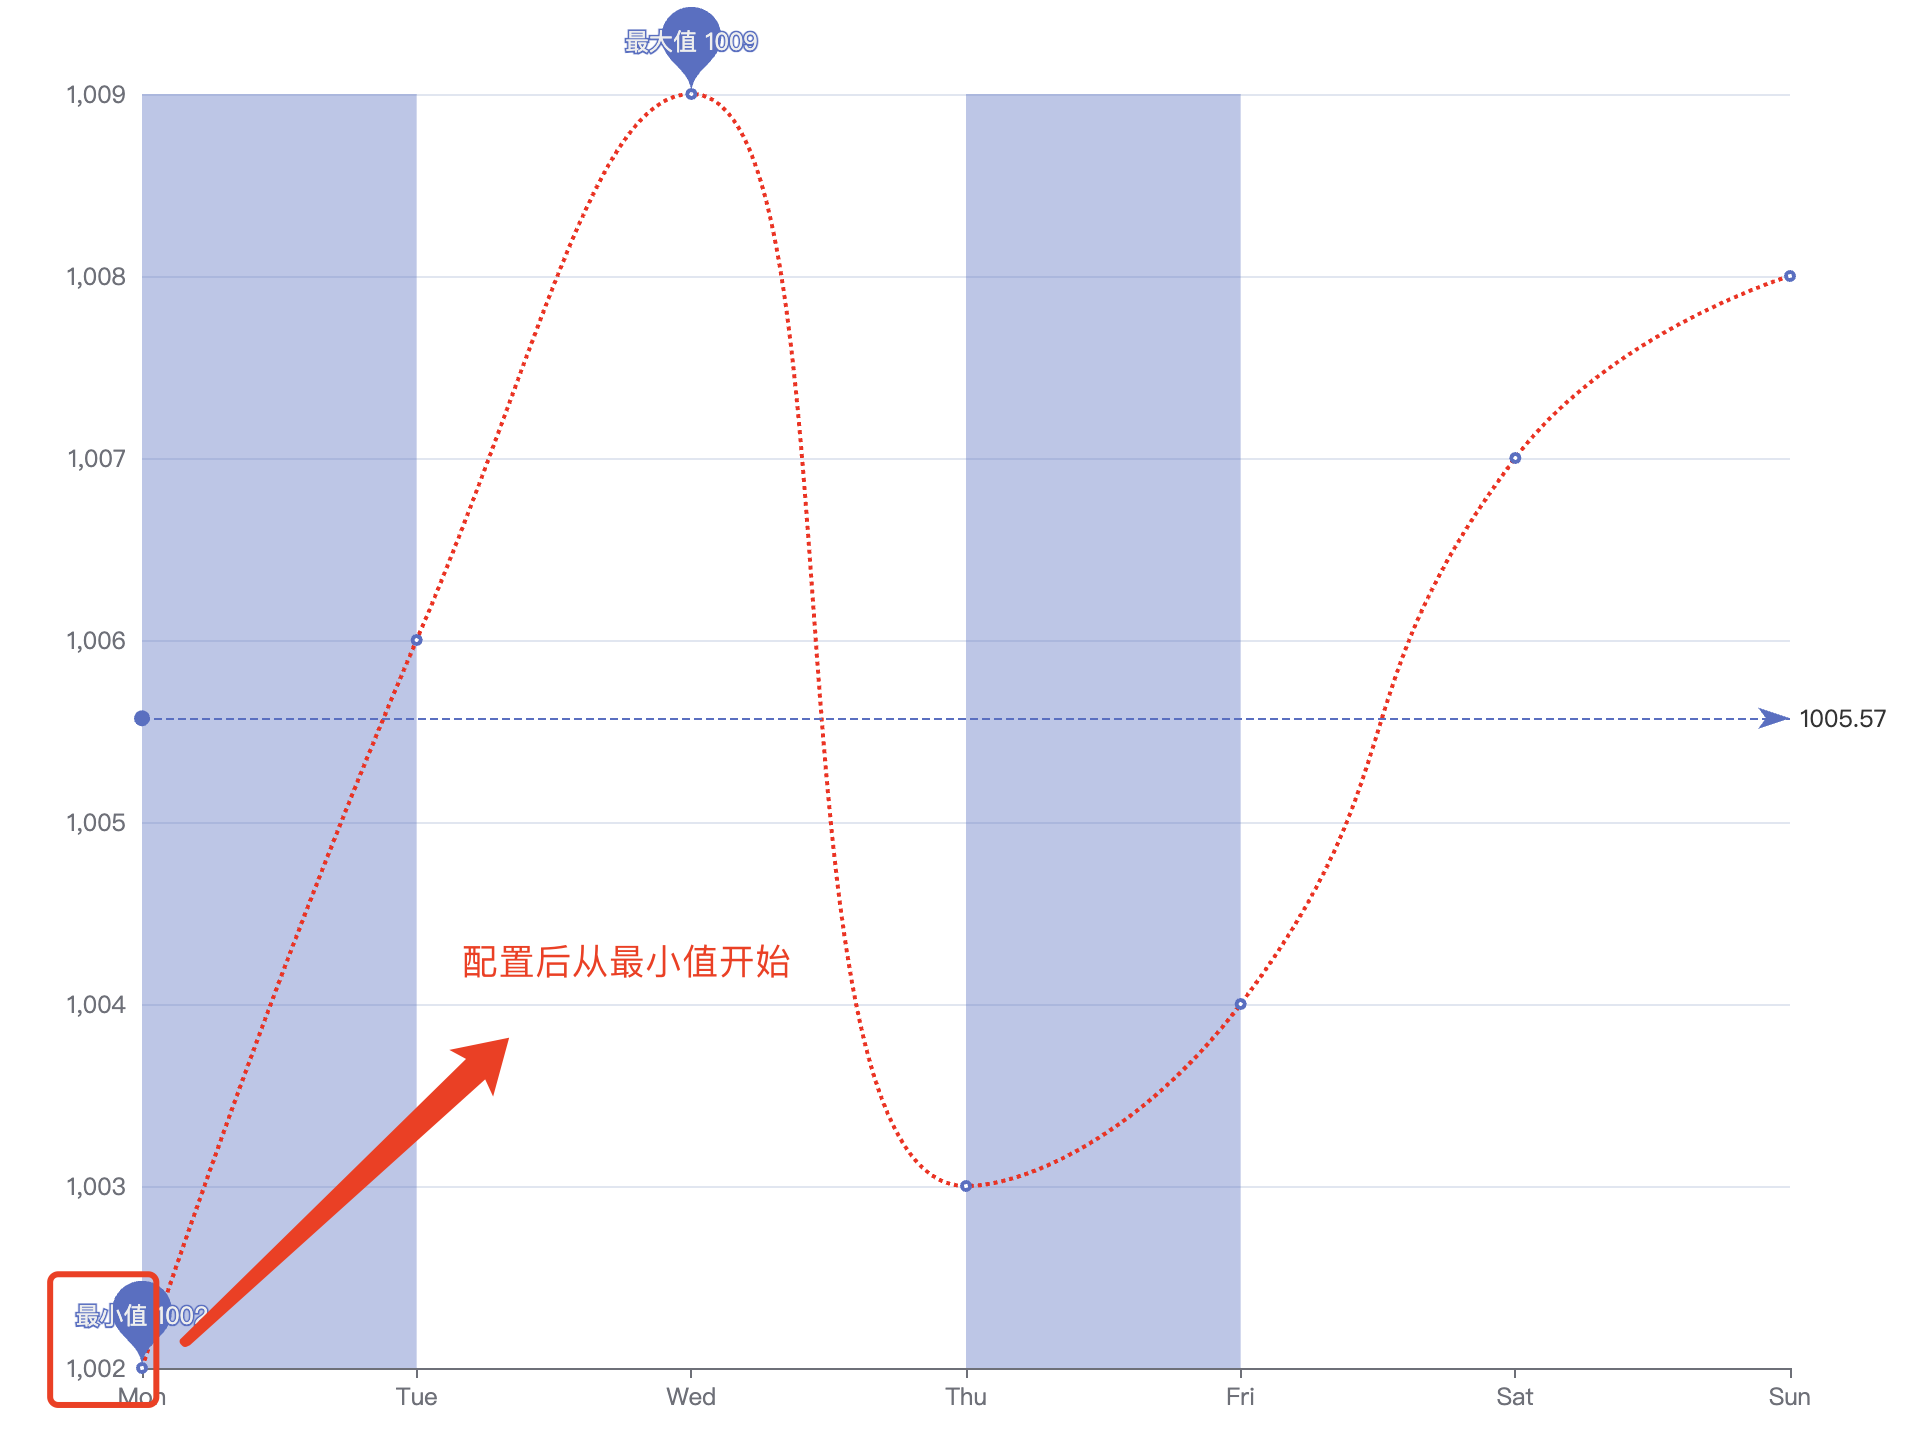
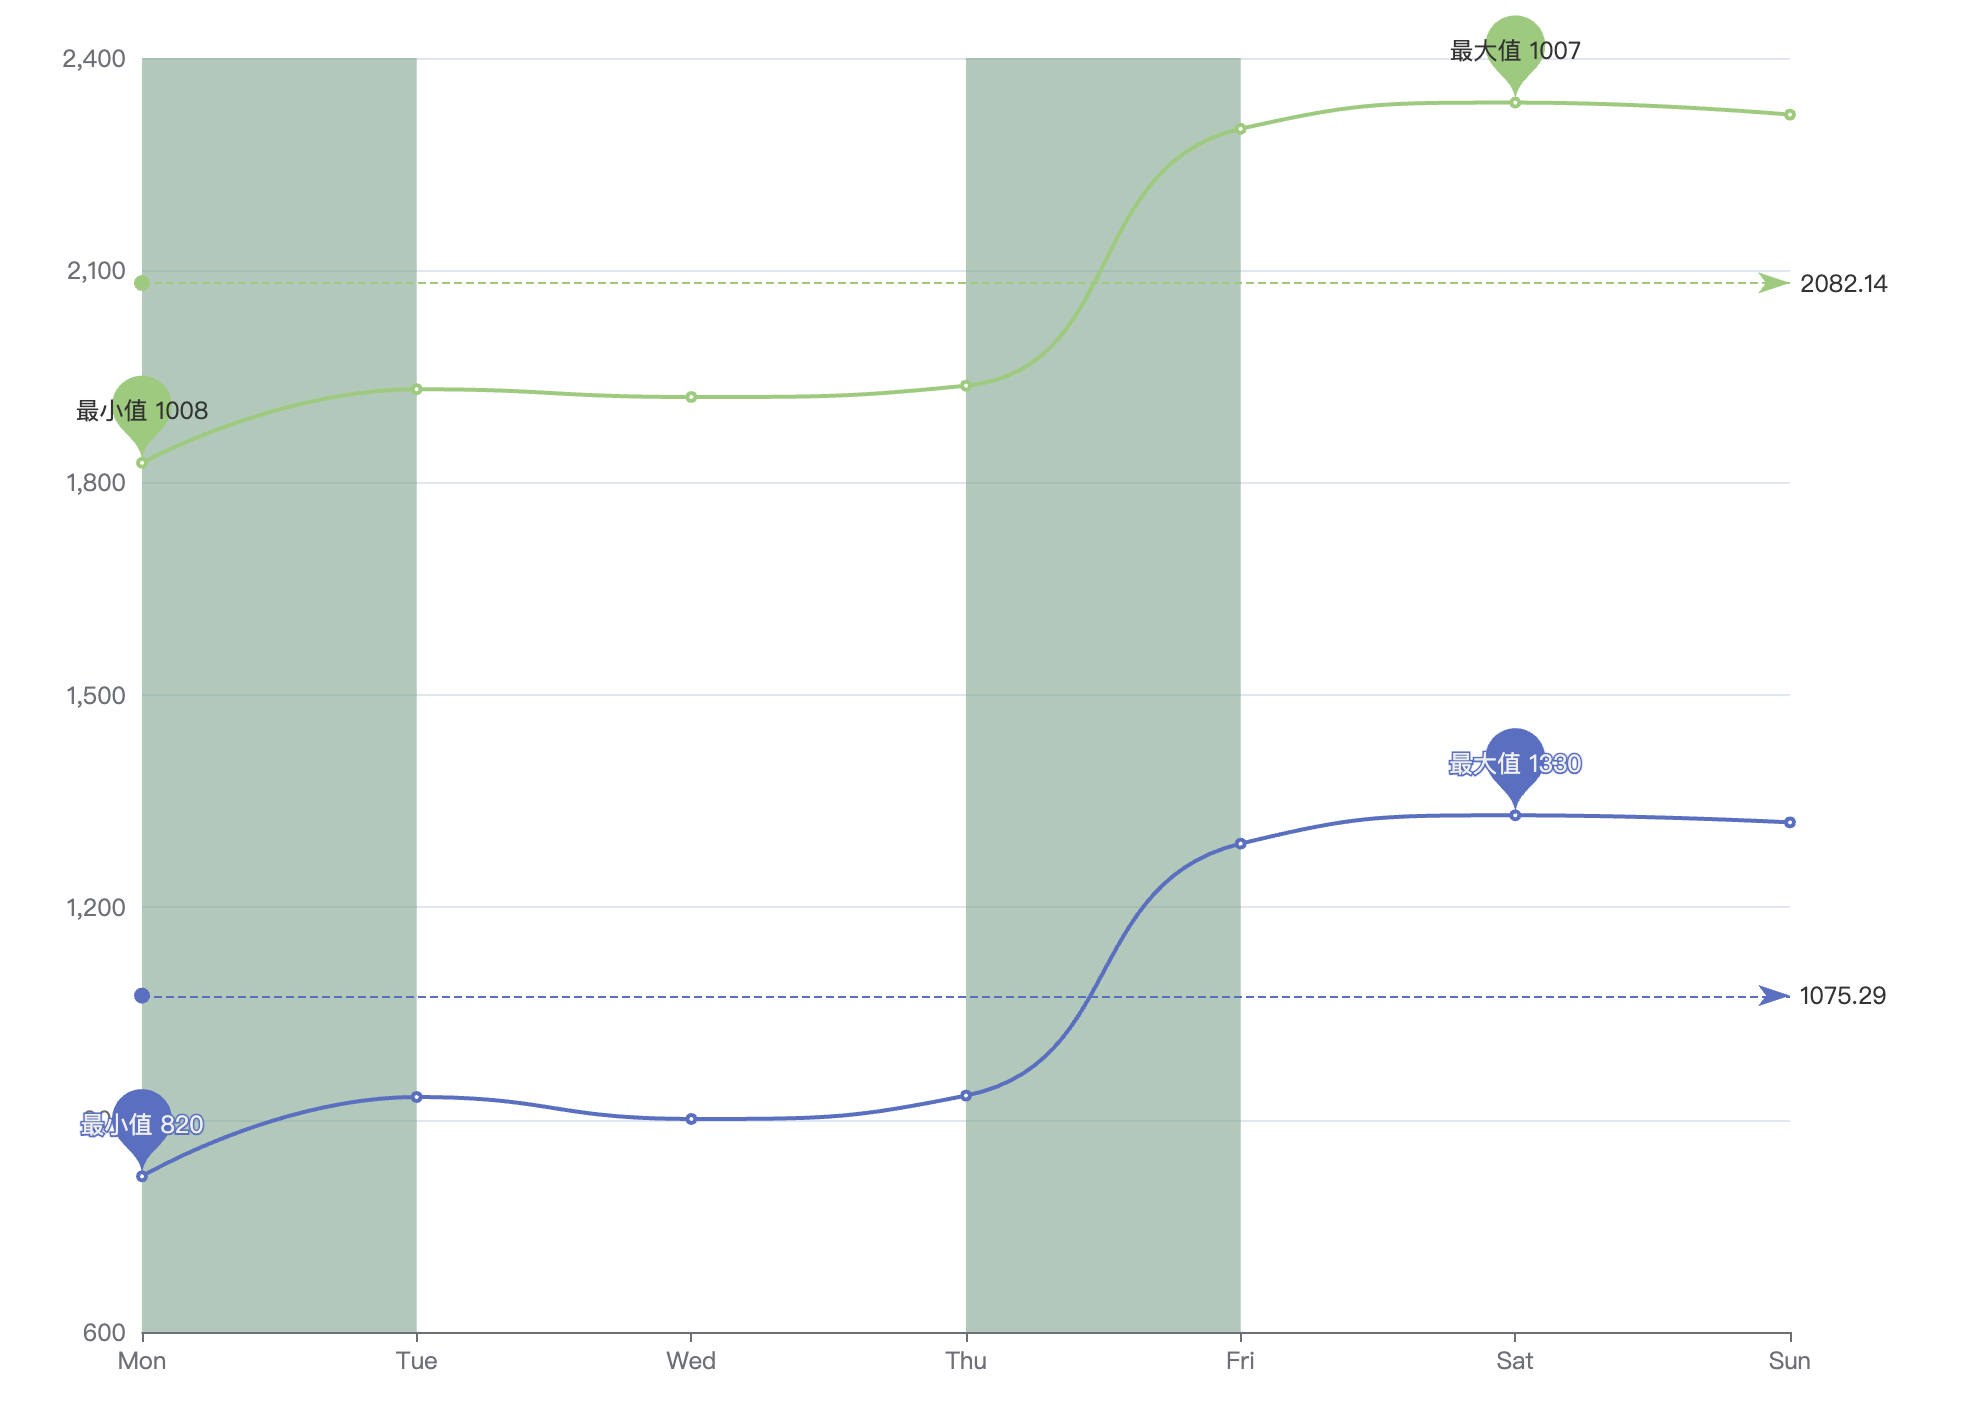
scale缩放比例属性
scale属性是yAxis和xAxis中的配置属性,仅处理type为"value"的,当value值相近时,无法从图表中更直观的显示,这时我们需要配置scale为true!
当value 值为[1002, 1006, 1009, 1003, 1004, 1007, 1008] 时,我们来看下效果!
配置scale
{
  yAxis: {
    type: "value",
    scale: true
  }
}
堆叠图折线图
堆叠折线图,就是
多个折线在一个图表上进行展示!实现
多个折线图,我们只需要在series系列中,配置多个type为line即可!
{
  series: [
    {
      type: "line",
      data: [50, 200, 150, 80, 70, 110, 130, 180, 200, 250, 230, 150, 100],
      smooth: true,
      lineStyle: {
        color: "red",
        type: "dotted" // solid 实线 dashed 虚线 dotted 点状线
      },
      markPoint: {
        label: {
          show: true,
          formatter: "{b} {c}"
        },
        data: [
          { type: "max", name: "最大值" },
          { type: "min", name: "最小值" }
        ]
      }
    },
    {
      type: "line",
      data: [40, 105, 150, 80, 195, 110, 150, 190, 189, 290, 230, 190, 90],
      smooth: true,
      lineStyle: {
        color: "red",
        type: "dotted" // solid 实线 dashed 虚线 dotted 点状线
      },
      markPoint: {
        label: {
          show: true,
          formatter: "{b} {c}"
        },
        data: [
          { type: "max", name: "最大值" },
          { type: "min", name: "最小值" }
        ]
      }
    }
  ]
}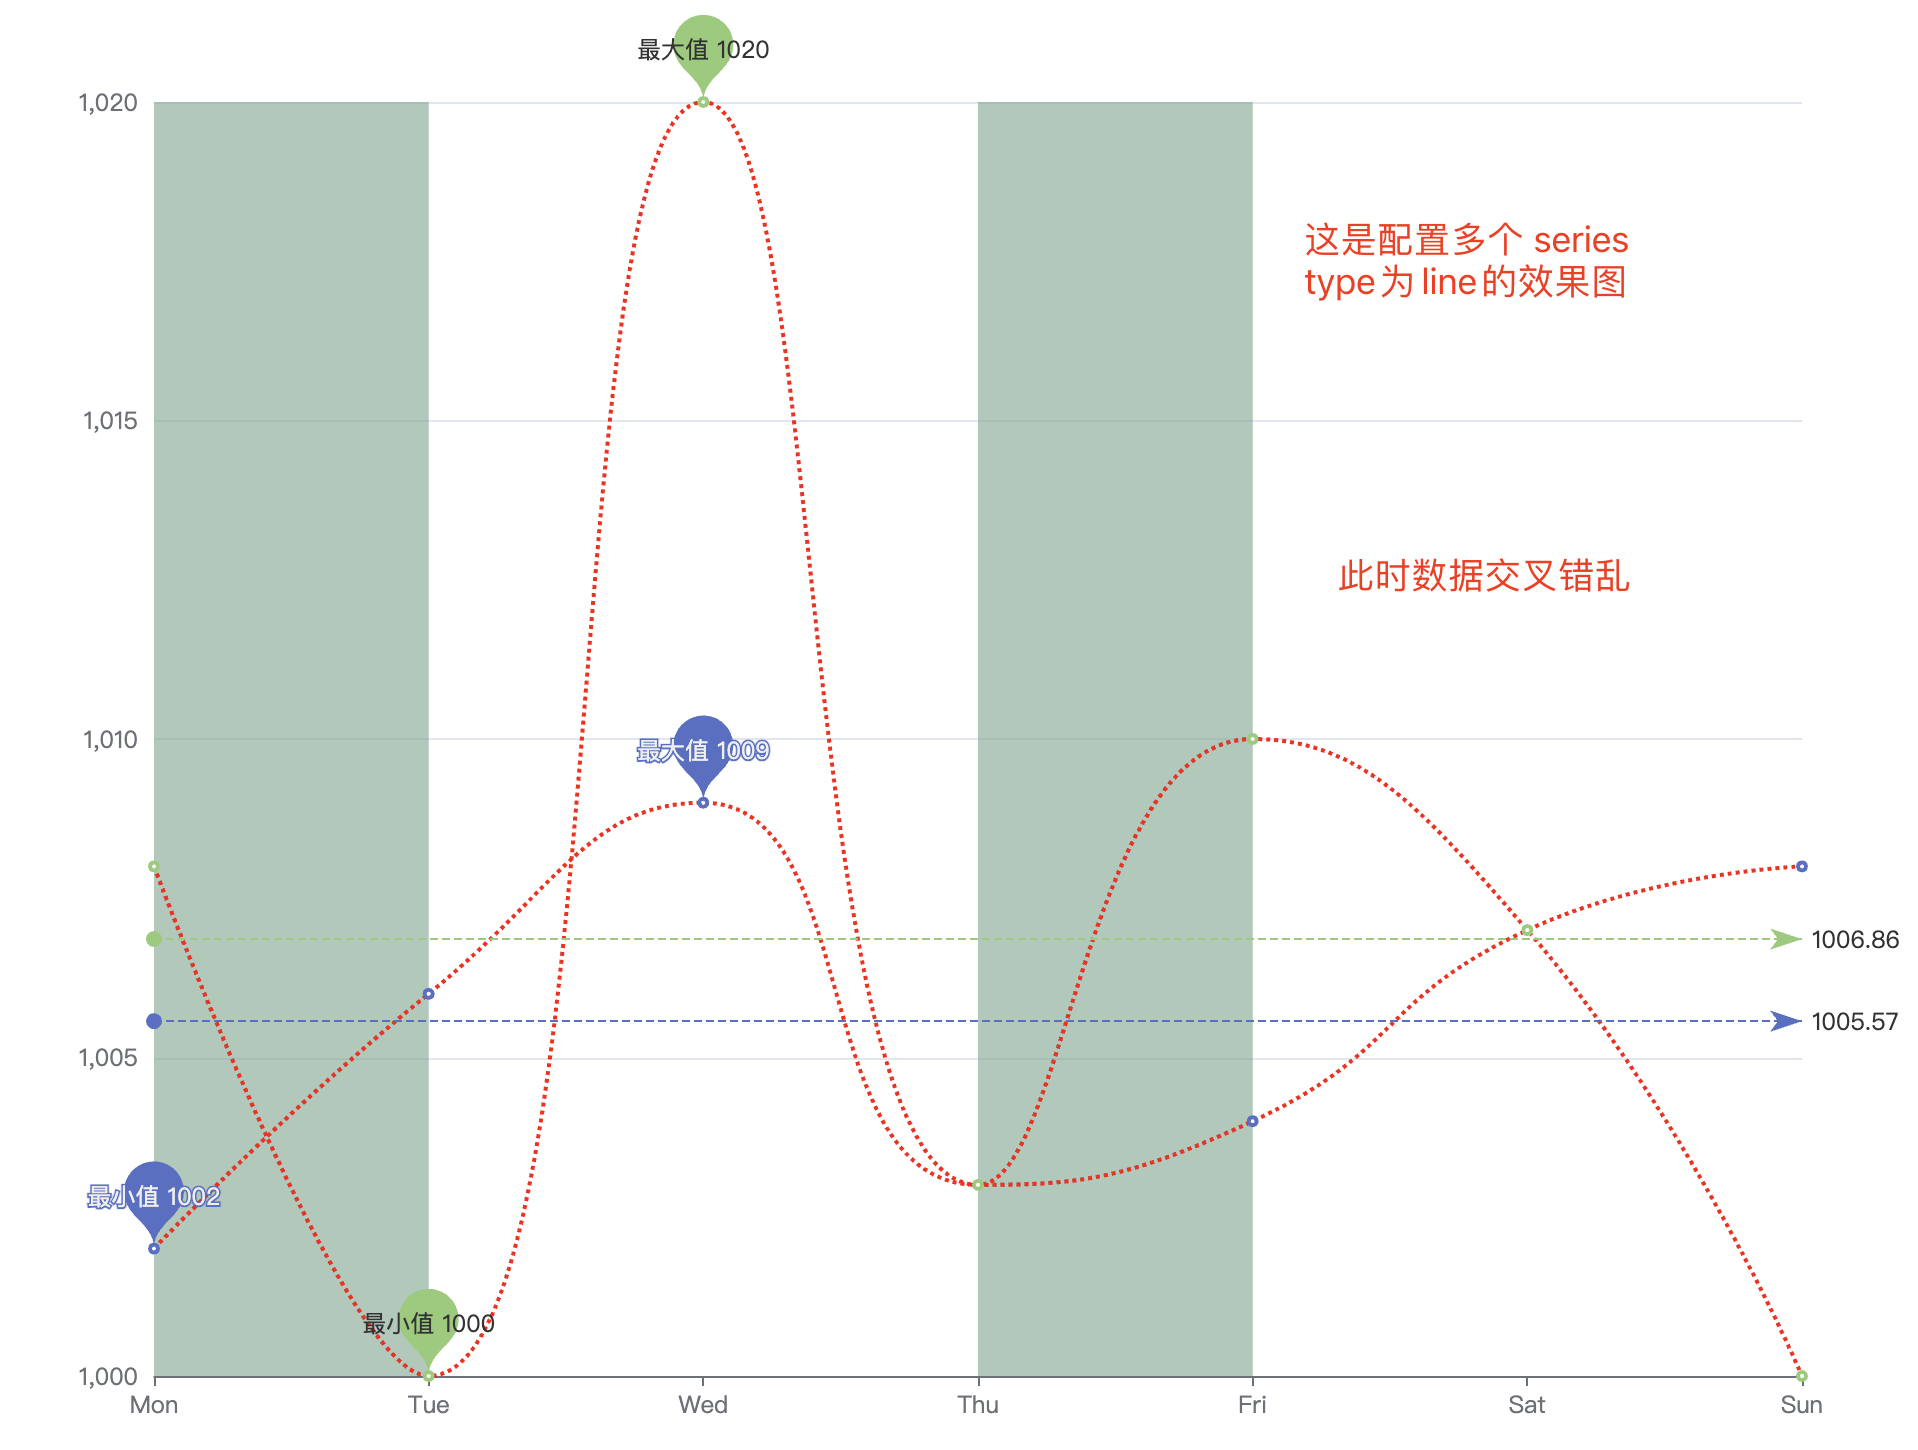
配置多个
series系列图表后,数据显示错综复杂,比较杂乱,接下来我们需要把两部分数据拆开展示,这就需要配置,stack属性来处理此问题! 我们在xAxis和yAxis中分别加入stack配置!
{
  xAxis: {
    stack: "all"
  },
  yAxis: {
    stack: "all"
  }
}
散点图
散点(
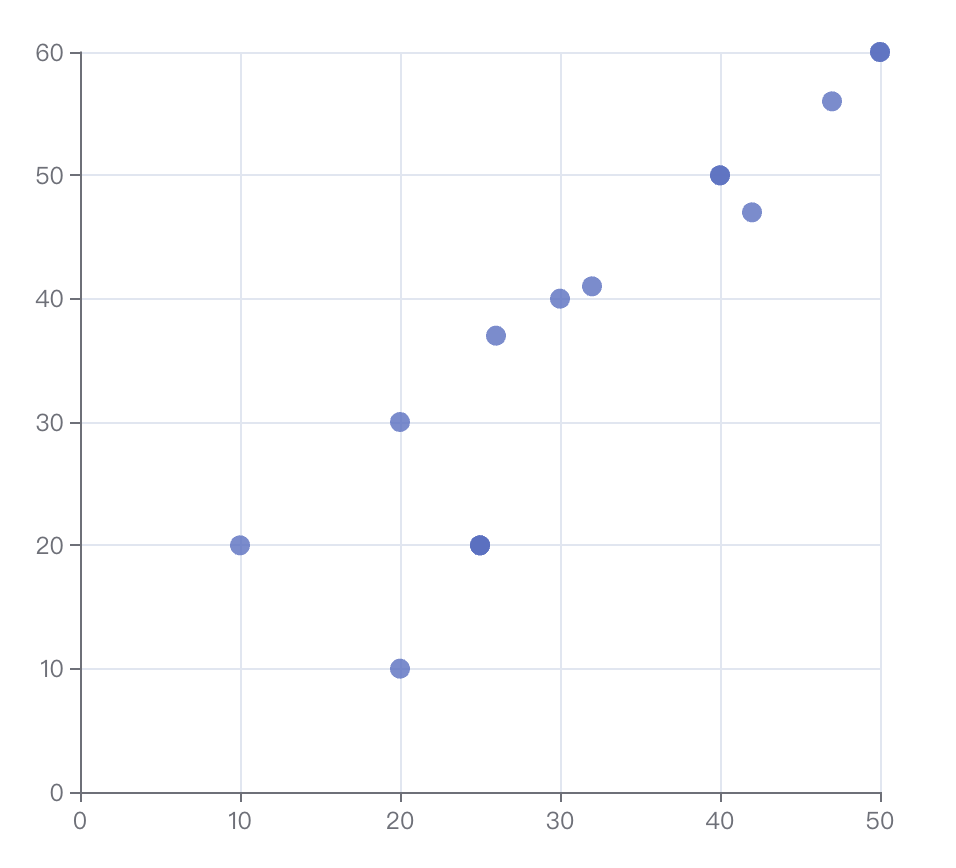
气泡)图。直角坐标系上的散点图可以用来展现数据的 x,y 之间的关系,如果数据项有多个维度,其它维度的值可以通过不同大小的 symbol 展现成气泡图,也可以用颜色来表现。这些可以配合 visualMap 组件完成。可以应用在直角坐标系,极坐标系,地理坐标系上。
展示散点图,只需要把
type对应属性值改为scatter即可!
{
  xAxis: {
    type: "value",
  },
  yAxis: {
    type: "value",
  },
  series: [
    {
      type: "scatter",
      data: [
        [10, 20],
        [20, 10],
        [20, 30],
        [25, 20],
        [30, 40],
        [40, 50],
        [50, 60],
        [25, 20],
        [26, 37],
        [40, 50],
        [50, 60],
        [25, 20],
        [32, 41],
        [42, 47],
        [47, 56],
      ],
    },
  ],
}
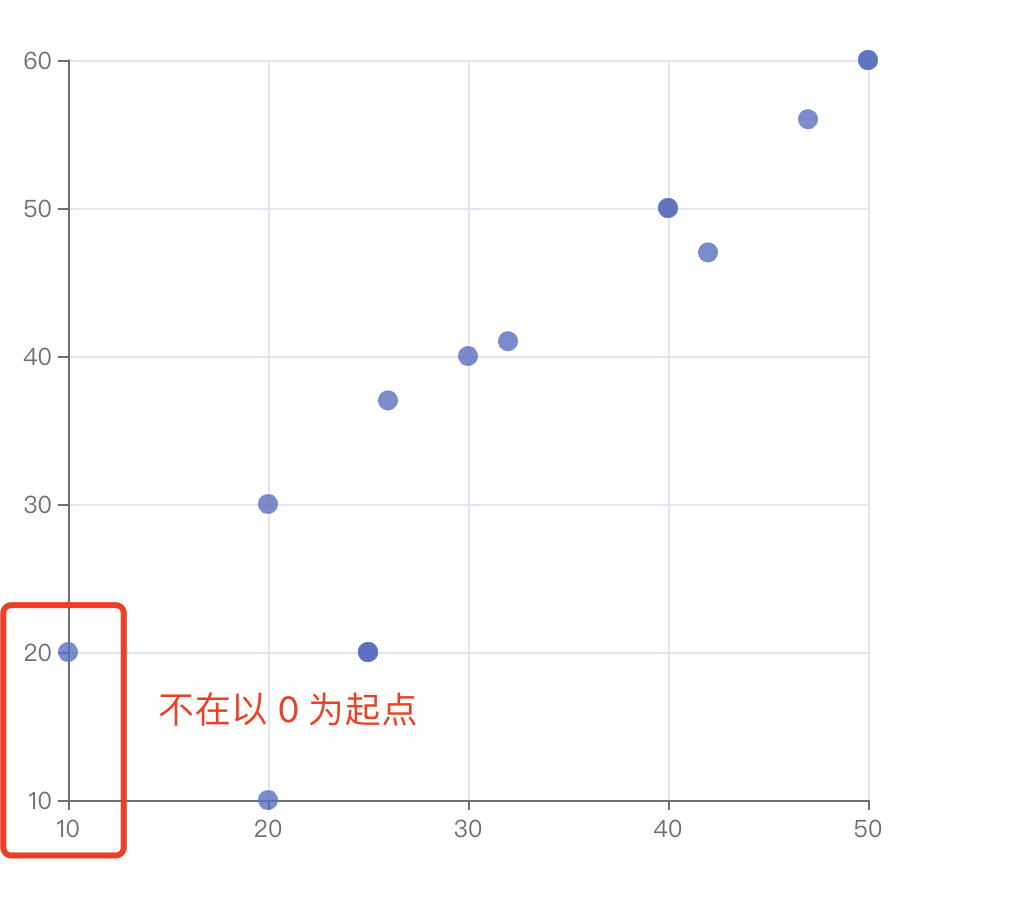
通过设置
scale属性来配置,x 和 y轴之间的0比例效果!
{
  xAxis: {
    type: "value",
    scale: true
  },
  yAxis: {
    type: "value",
    scale: true
  },
}
气泡效果
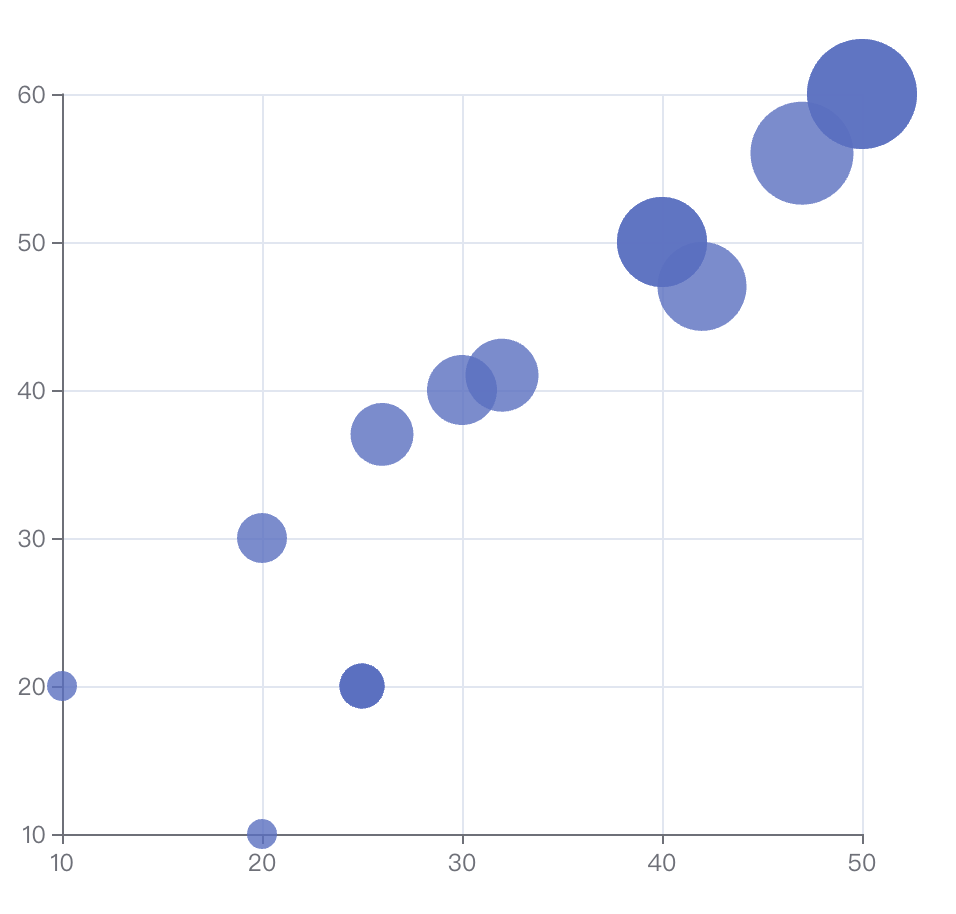
通过
symbolSize属性来自定义点状大小,属性值类型为number, 或回调函数callback!
{
  xAxis: {
    type: "value",
  },
  yAxis: {
    type: "value",
  },
  series: [
    {
      type: "scatter",
      // symbolSize: 10, // 固定值
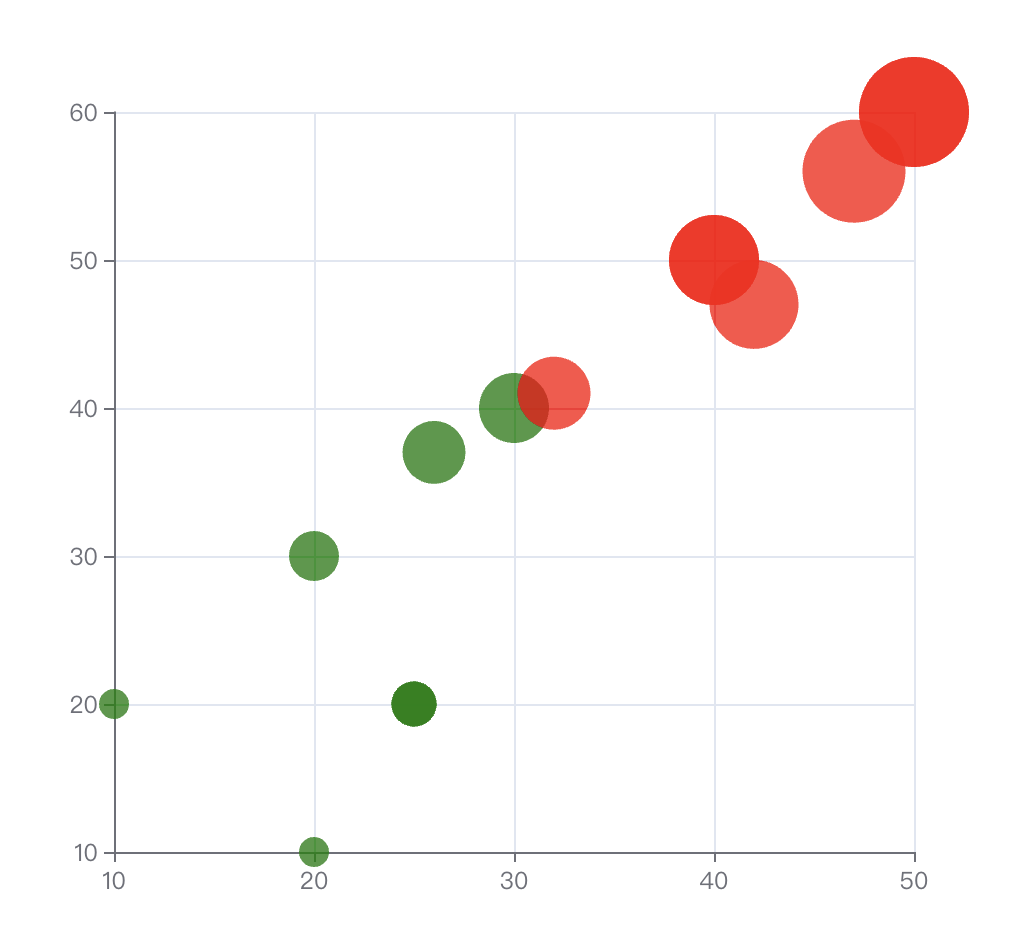
      symbolSize: function( arr ){
        return (arr[0] + arr[1]) / 2;
      }, // 自定义点状大小
      data: [
        [10, 20],
        [20, 10],
        [20, 30],
        [25, 20],
        [30, 40],
        [40, 50],
        [50, 60],
        [25, 20],
        [26, 37],
        [40, 50],
        [50, 60],
        [25, 20],
        [32, 41],
        [42, 47],
        [47, 56],
      ],
    },
  ],
}
通过
itemStyle属性中的color属性来自定义点状颜色!
{
  xAxis: {
    type: "value",
  },
  yAxis: {
    type: "value",
  },
  series: [
    {
      type: "scatter",
      // symbolSize: 10, // 固定值
      symbolSize: function( arr ){
        return (arr[0] + arr[1]) / 2;
      }, // 自定义点状大小
      itemStyle: {
        color: function( val ){
          return (val.data[0] + val.data[1]) / 2 > 35 ? "red" : "green";
        }
      }, // 自定义点状颜色
      data: [
        [10, 20],
        [20, 10],
        [20, 30],
        [25, 20],
        [30, 40],
        [40, 50],
        [50, 60],
        [25, 20],
        [26, 37],
        [40, 50],
        [50, 60],
        [25, 20],
        [32, 41],
        [42, 47],
        [47, 56],
      ],
    },
  ],
}
涟漪动画
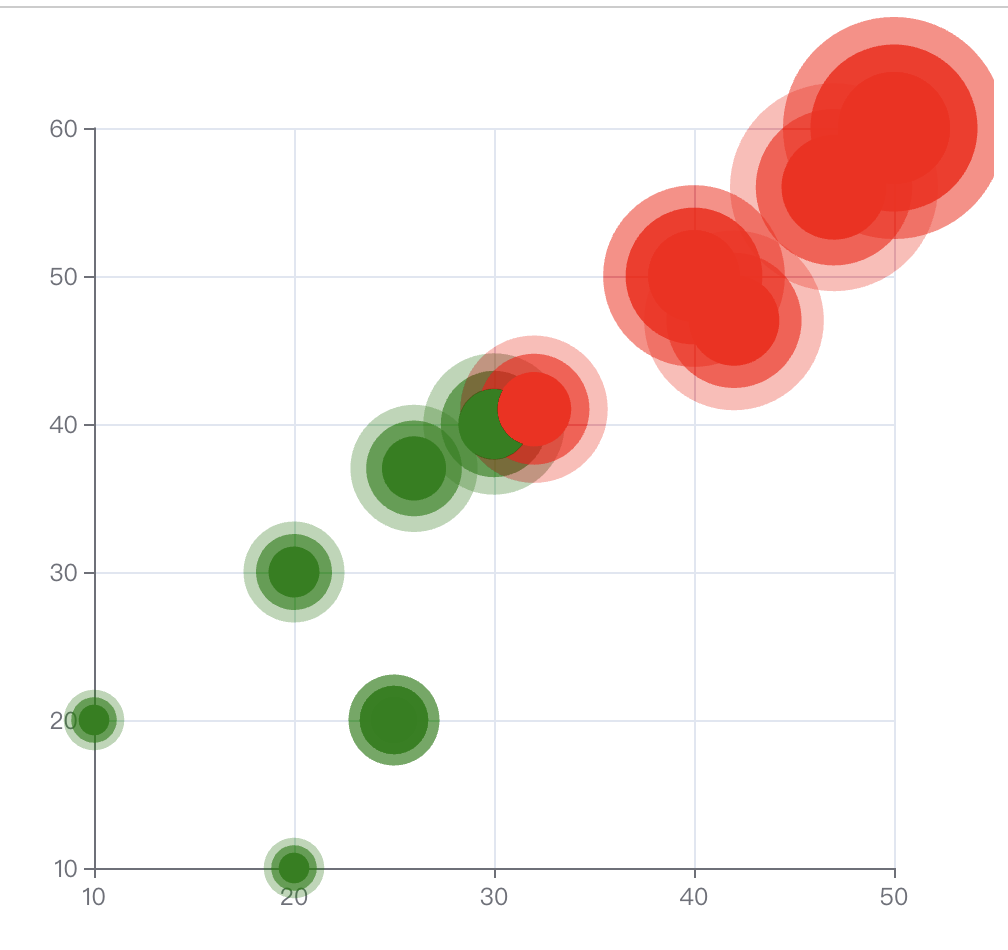
涟漪动画是通过改变type属性值来实现的,type: scatter改为type: effectScatter即可!
{
  series: [
    {
      type: "effectScatter",
      // 涟漪效果触发时机, 渲染的时候 或者鼠标移入的时候
      showEffectOn: "emphasis", // render 渲染 emphasis 鼠标移入
      // symbolSize: 10, // 固定值
      symbolSize: function( arr ){
        return (arr[0] + arr[1]) / 2;
      }, // 自定义点状大小
      itemStyle: {
        color: function( val ){
          return (val.data[0] + val.data[1]) / 2 > 35 ? "red" : "green";
        }
      }, // 自定义点状颜色
      data: [
        [10, 20],
        [20, 10],
        [20, 30],
        [25, 20],
        [30, 40],
        [40, 50],
        [50, 60],
        [25, 20],
        [26, 37],
        [40, 50],
        [50, 60],
        [25, 20],
        [32, 41],
        [42, 47],
        [47, 56],
      ],
    },
  ]
}
showEffectOn来控制,涟漪动画展示的时机,比如一开始渲染的时候,或者是鼠标移入的时候显示涟漪效果!
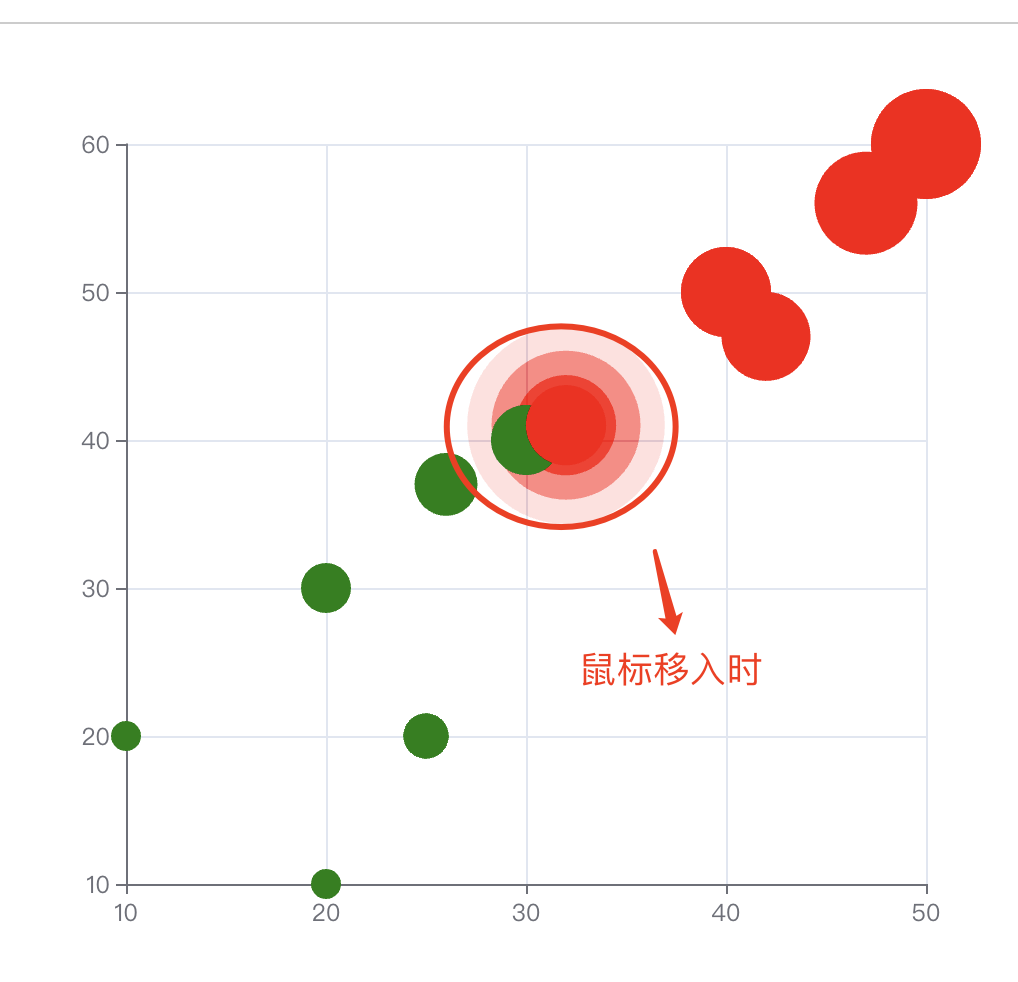
rippleEffect用来配置涟漪效果基本配置! 如涟漪的颜色,波纹的数量等!
rippleEffect 相关配置文档!
{
  series: [
    {
      type: "effectScatter",
      // 涟漪效果触发时机, 渲染的时候 或者鼠标移入的时候
      showEffectOn: "emphasis", // render 渲染 emphasis 鼠标移入
      rippleEffect: {
        scale: 3
      },
      // symbolSize: 10, // 固定值
      symbolSize: function( arr ){
        return (arr[0] + arr[1]) / 2;
      }, // 自定义点状大小
      itemStyle: {
        color: function( val ){
          return (val.data[0] + val.data[1]) / 2 > 35 ? "red" : "green";
        }
      }, // 自定义点状颜色
      data: [
        [10, 20],
        [20, 10],
        [20, 30],
        [25, 20],
        [30, 40],
        [40, 50],
        [50, 60],
        [25, 20],
        [26, 37],
        [40, 50],
        [50, 60],
        [25, 20],
        [32, 41],
        [42, 47],
        [47, 56],
      ],
    },
  ]
}
直角坐标系
grid 网格
网格可以定义图表,宽高 背景 模糊 位置等相关设置!
{
  grid: {
    show: true
  }
}
axis 坐标轴
xAxis 相关配置!
yAxis 相关配置!
坐标轴分为
xAxis和yAxis, 有一个共同属性为type,通过此属性,可以配置该轴,为类目轴,还是为value轴!当
type属性为类目轴 category时,其中data属性值不能为空,若为value时,则自动取值为series!
dataZoom 缩放
dataZoom相关配置!
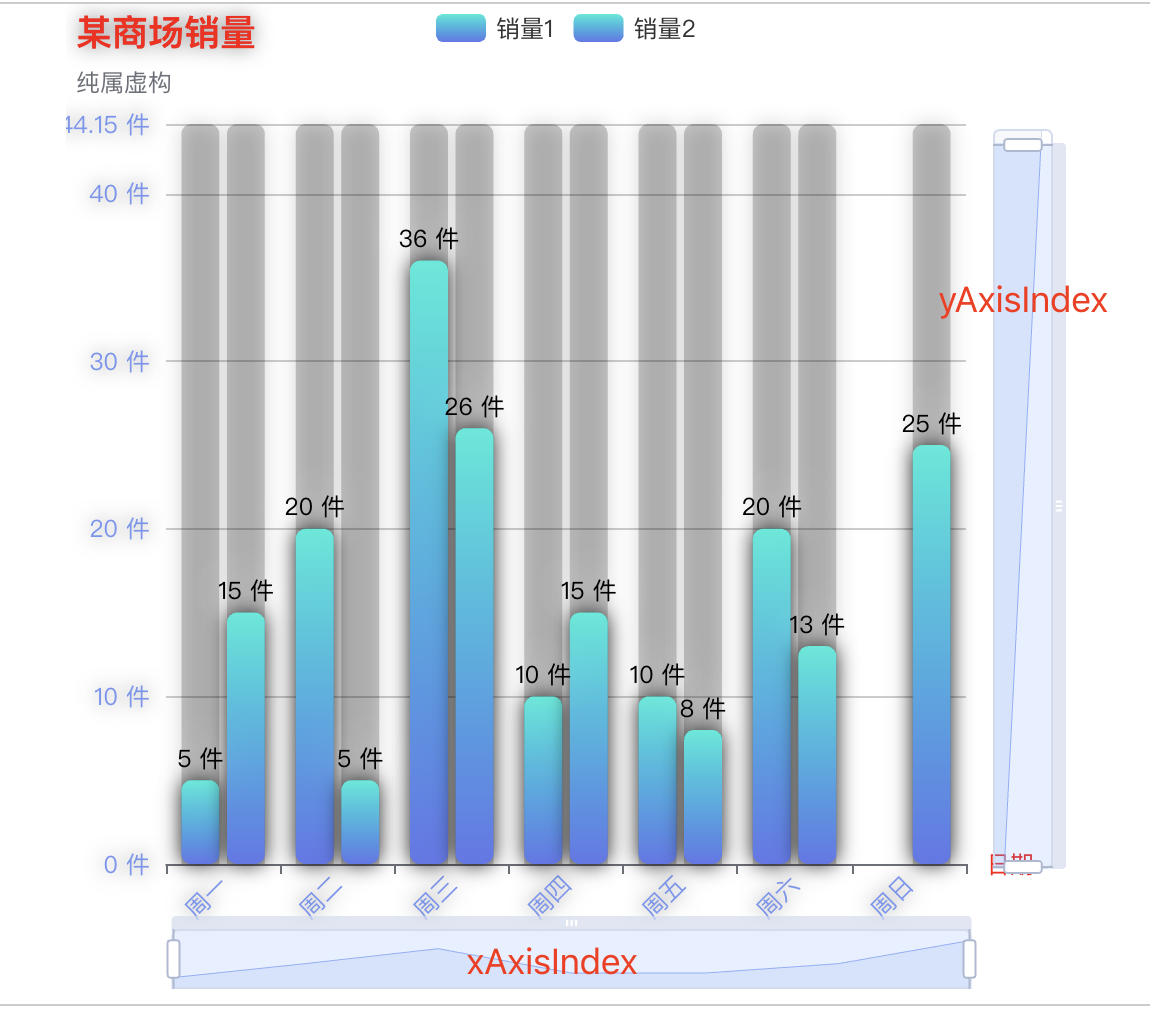
dataZoom组件 用于区域缩放,从而能自由关注细节的数据信息,或者概览数据整体,或者去除离群点的影响。
dataZoom是一个数组,可以配置多个缩放区域!
type 属性
slider滑块inside内置,依靠鼠标滚轮,或者双指缩放!
指明哪个轴需要加入滑块儿
yAxisIndex设置缩放组件控制在y轴,一般写0即可!xAxisIndex设置缩放组件控制在x轴,一般写0即可!
{
  dataZoom: [
    {
      type: "slider", // 滑动条
      start: 0, // 开始位置
      end: 100, // 结束位置
      show: true, // 是否显示
      xAxisIndex: 0, // 指定x轴
    },
    {
      type: "slider", // 滑动条
      start: 0, // 开始位置
      end: 100, // 结束位置
      show: true, // 是否显示
      yAxisIndex: 0, // 指定y轴
    },
    {
      type: "inside", // 内置
      start: 0, // 开始位置
      end: 100, // 结束位置
      show: true, // 是否显示
    },
  ]
}
饼图
pie 饼图配置文档!
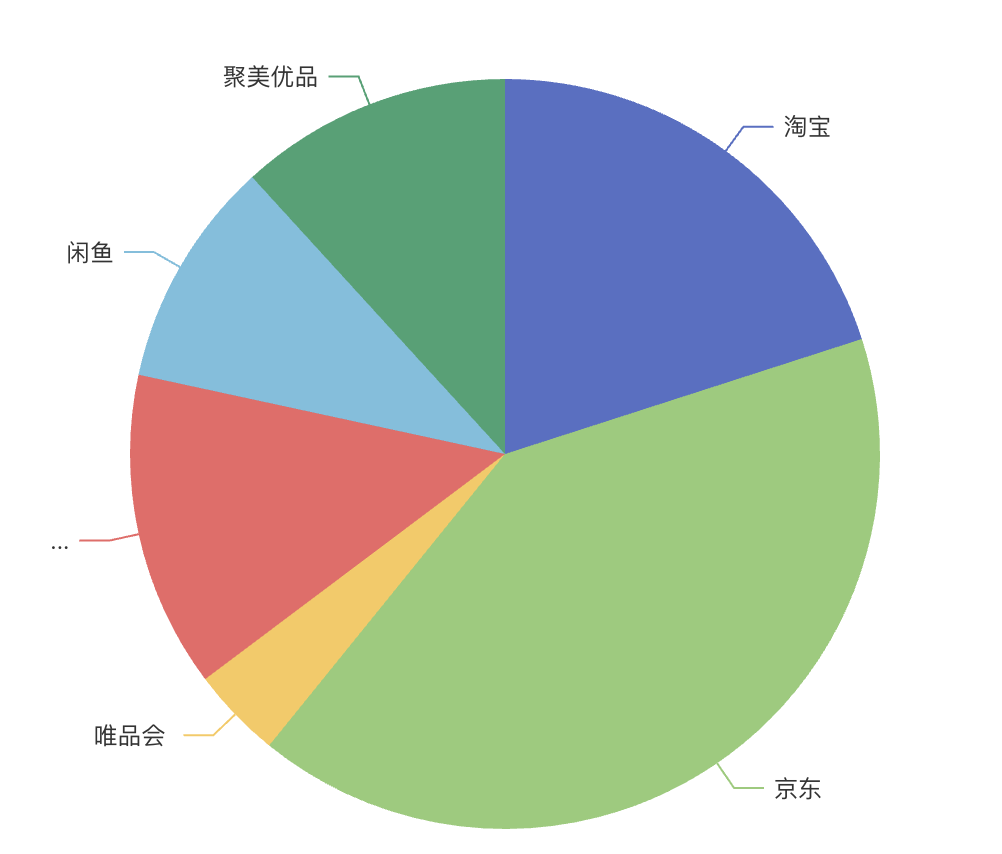
饼图主要用于表现不同类目的数据在总和中的占比。每个的弧度表示数据数量的比例。
在饼图中没有
x 轴和y 轴, 所以我们只需要配置series type为pie即可!
{
  series: [
    {
      type: "pie",
      data: [
        { name: "淘宝", value: 10284 },
        { name: "京东", value: 20934 },
        { name: "唯品会 ", value: 2013 },
        { name: "拼多多 ", value: 7002 },
        { name: "闲鱼", value: 5045 },
        { name: "聚美优品", value: 6045 },
      ],
    },
  ],
};
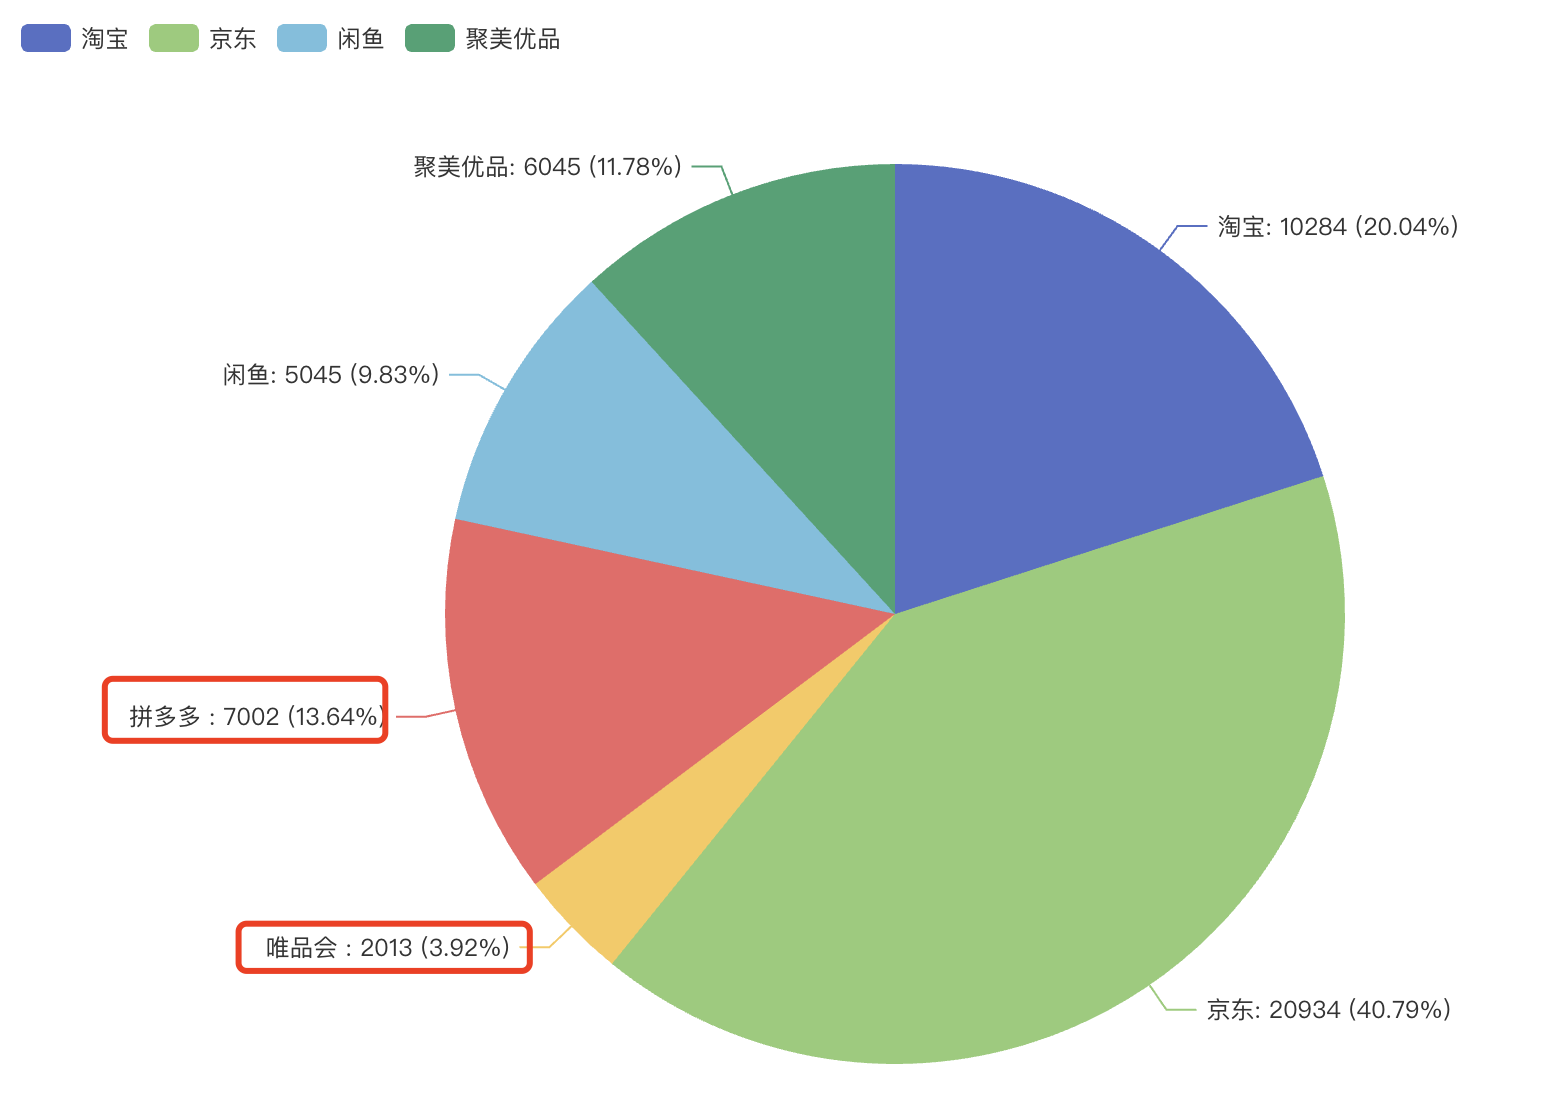
label标签格式化
通过
label中的formatter来设置标签的更多信息展示!
{
  series: [
      type: "pie",
      data: [
        { name: "淘宝", value: 10284 },
        { name: "京东", value: 20934 },
        { name: "唯品会 ", value: 2013 },
        { name: "拼多多 ", value: 7002 },
        { name: "闲鱼", value: 5045 },
        { name: "聚美优品", value: 6045 },
      ],
    label: {
      formatter: "{b}: {c} ({d}%)",
      /*formatter(val){
        return "配合val来定义标签显示值!";
      }*/
    }
  ]
}
设置圆环效果
radius 详细配置!
圆环效果是通过
radius来配置的饼图的半径。可以为如下类型:
number:直接指定外半径值。
string:例如,'20%',表示外半径为可视区尺寸(容器高宽中较小一项)的 20% 长度。
Array.<number|string>:数组的第一项是内半径,第二项是外半径。每一项遵从上述numberstring的描述。
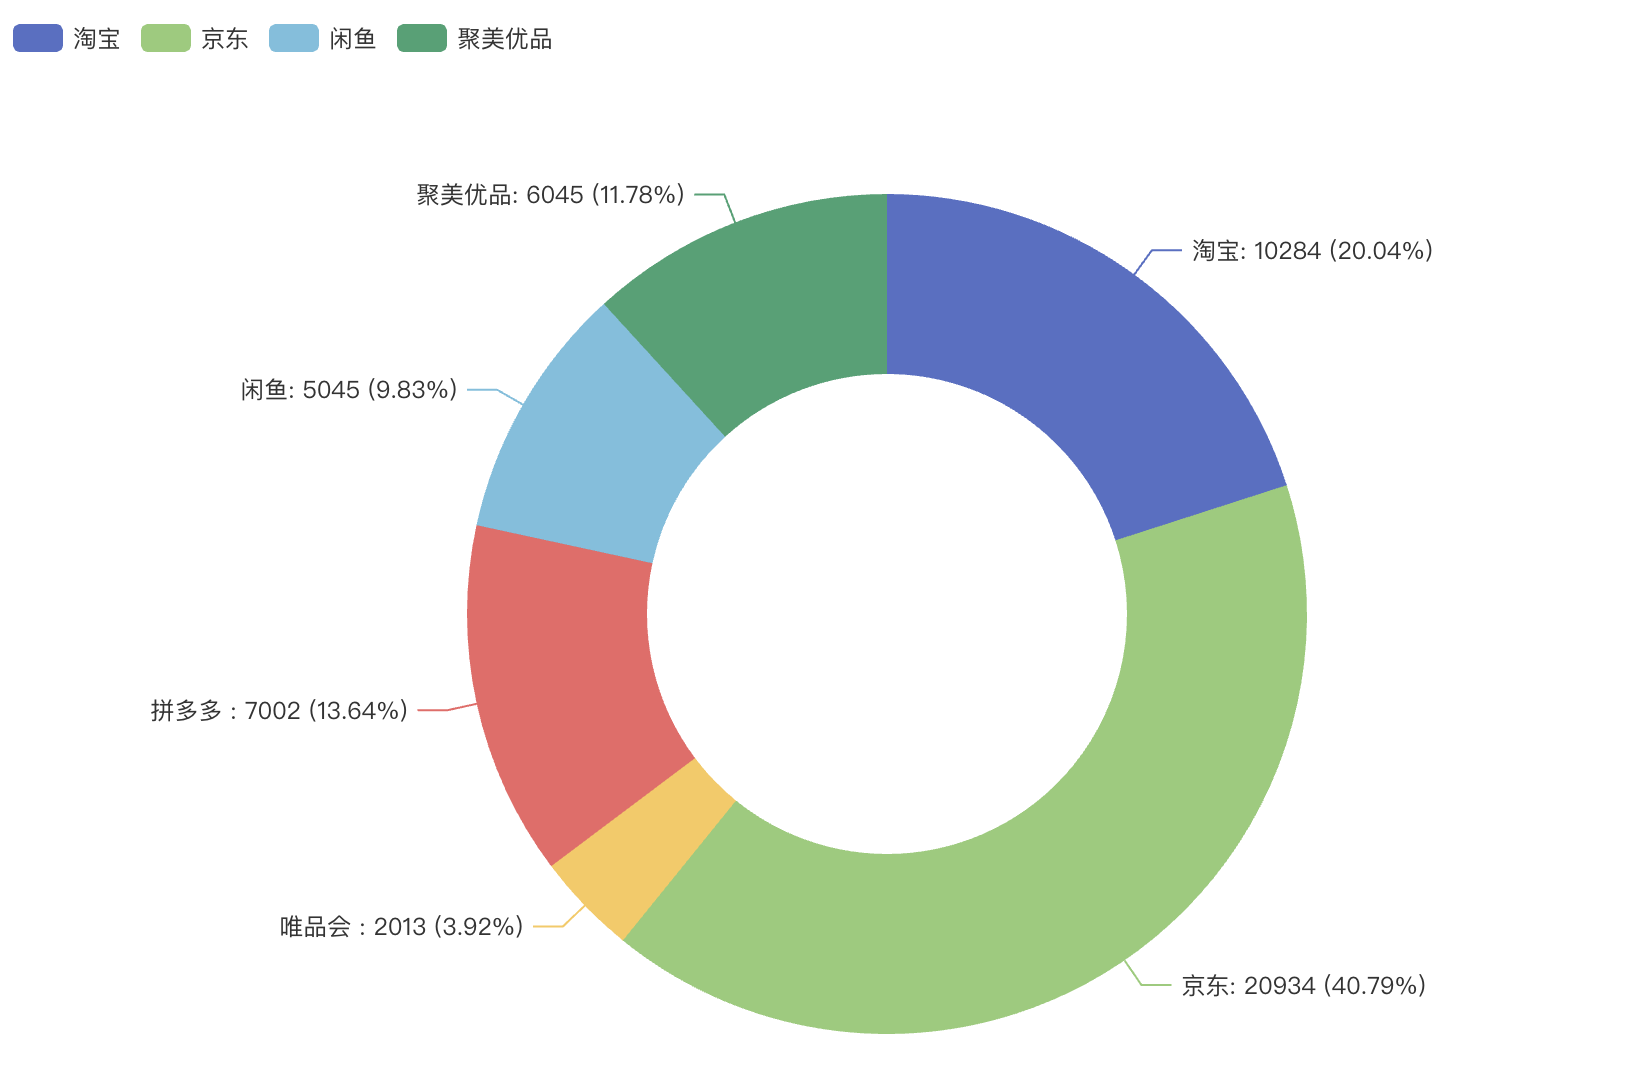
{
  series: [
      type: "pie",
      radius: ["40%", "70%"],
      data: [
        { name: "淘宝", value: 10284 },
        { name: "京东", value: 20934 },
        { name: "唯品会 ", value: 2013 },
        { name: "拼多多 ", value: 7002 },
        { name: "闲鱼", value: 5045 },
        { name: "聚美优品", value: 6045 },
      ],
    label: {
      formatter: "{b}: {c} ({d}%)",
    }
  ]
}
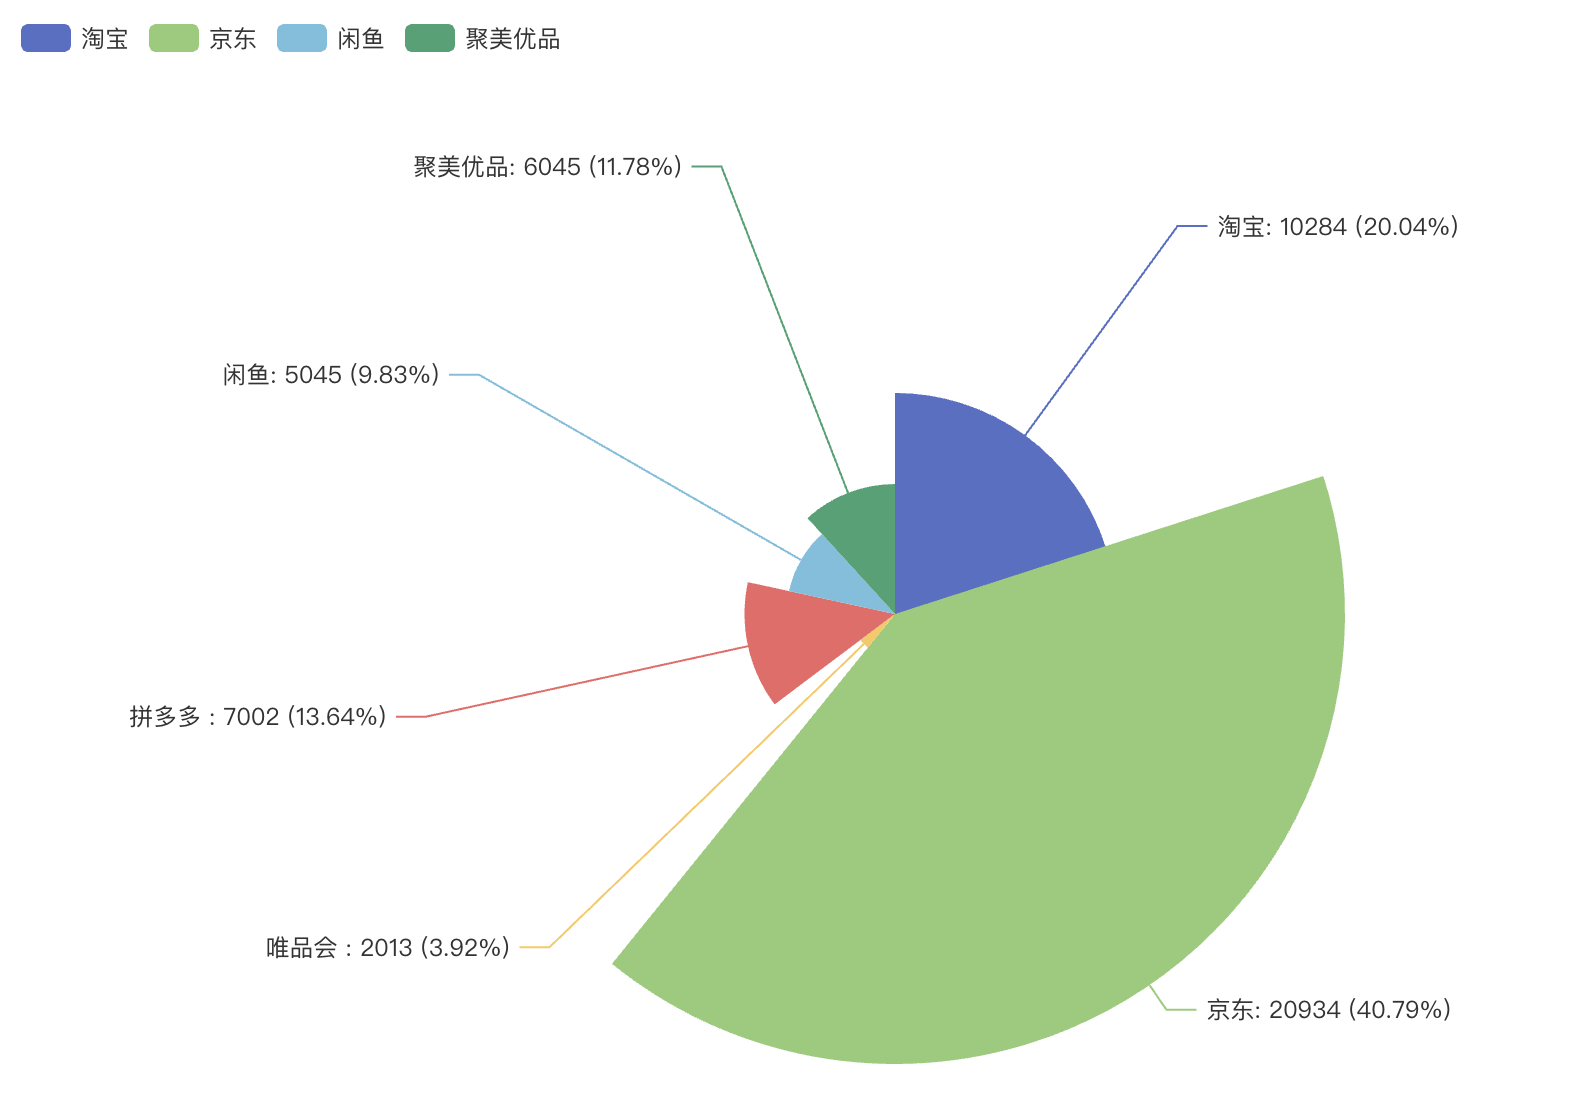
南丁格尔图
南丁格尔图设置每个半径大小不同,半径大小随着数值变化而变化!
南丁格尔图是通过roseType属性来配置!是否展示成南丁格尔图,通过半径区分数据大小。可选择
两种模式:
'radius'扇区圆心角展现数据的百分比,半径展现数据的大小。
'area'所有扇区圆心角相同,仅通过半径展现数据大小。
{
  series: [
      type: "pie",
      roseType: "radius",
      data: [
        { name: "淘宝", value: 10284 },
        { name: "京东", value: 20934 },
        { name: "唯品会 ", value: 2013 },
        { name: "拼多多 ", value: 7002 },
        { name: "闲鱼", value: 5045 },
        { name: "聚美优品", value: 6045 },
      ],
    label: {
      formatter: "{b}: {c} ({d}%)",
    }
  ]
}
设置选中效果
选中效果是通过
selectedMode属性来配置的,该属性值有两个一个为'single',另一个为'multiple'!
single属性值配置后,选中时,被选中的图表将会脱离原来位置并偏移一段距离!当选择另一个图表是,之前被选中的会恢复到原来位置!
multiple属性配置后,选中时,被选中的图表将会脱离原来位置并偏移一段距离!可以选择多个图表,之前被选中的图表 不会恢复到原来位置!
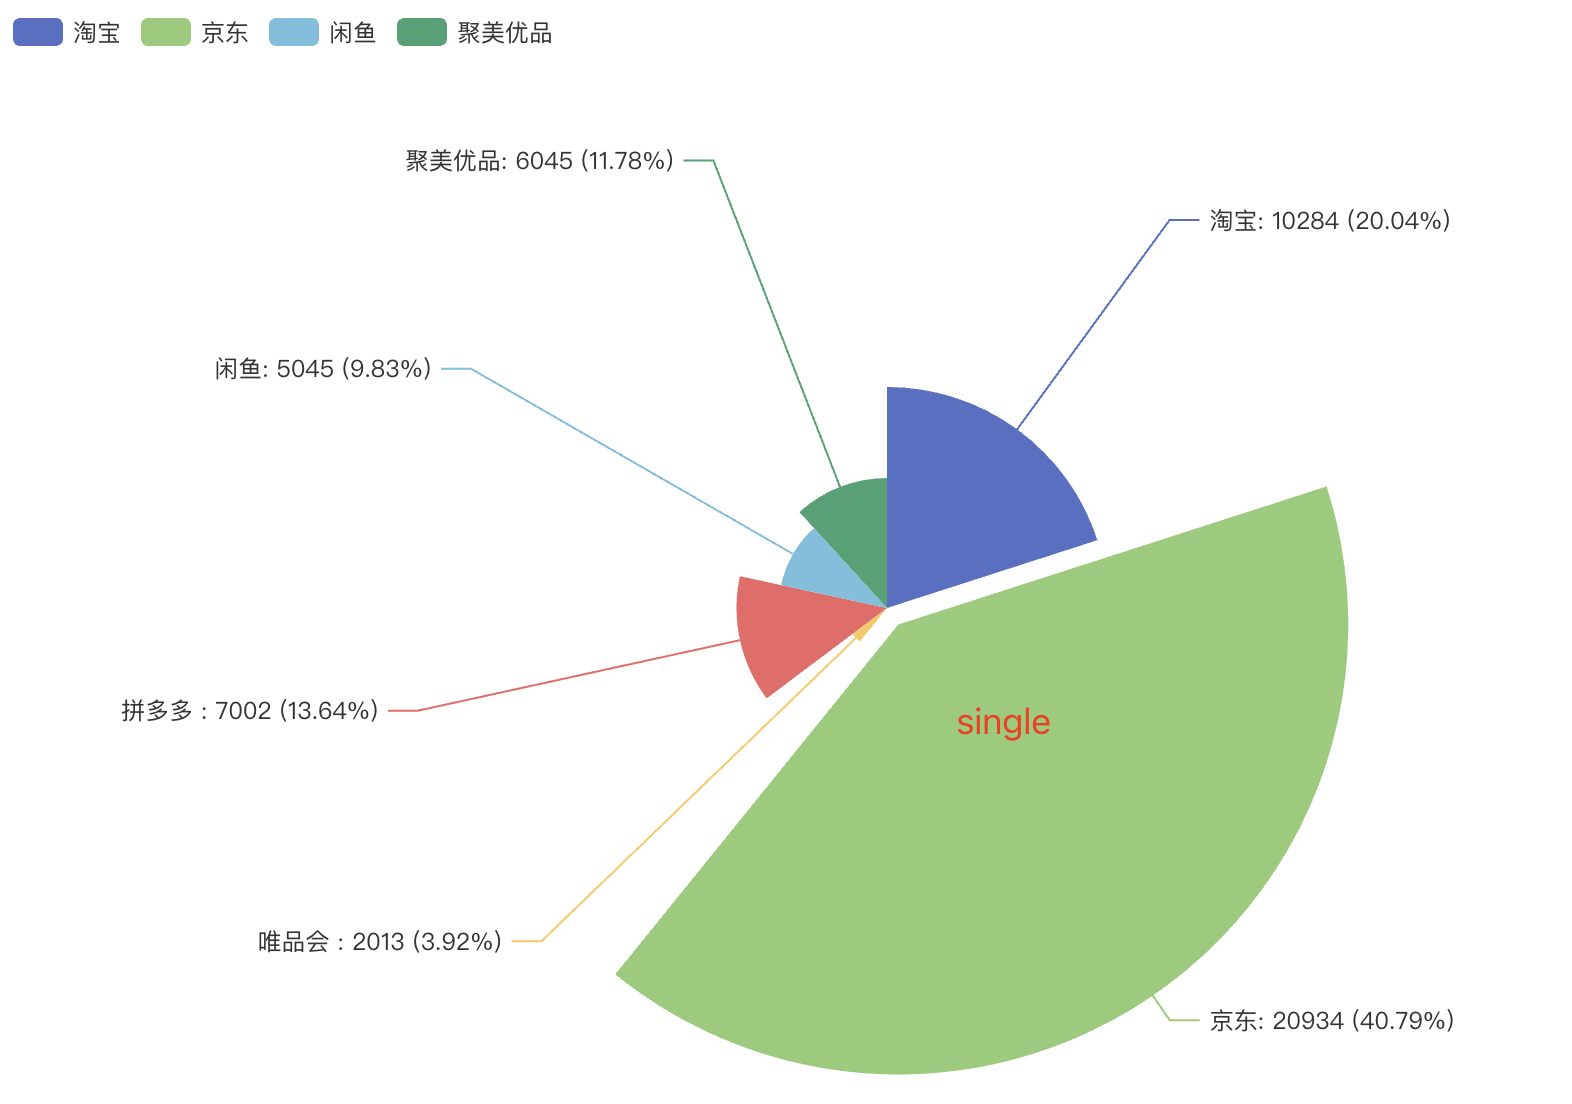
single 效果
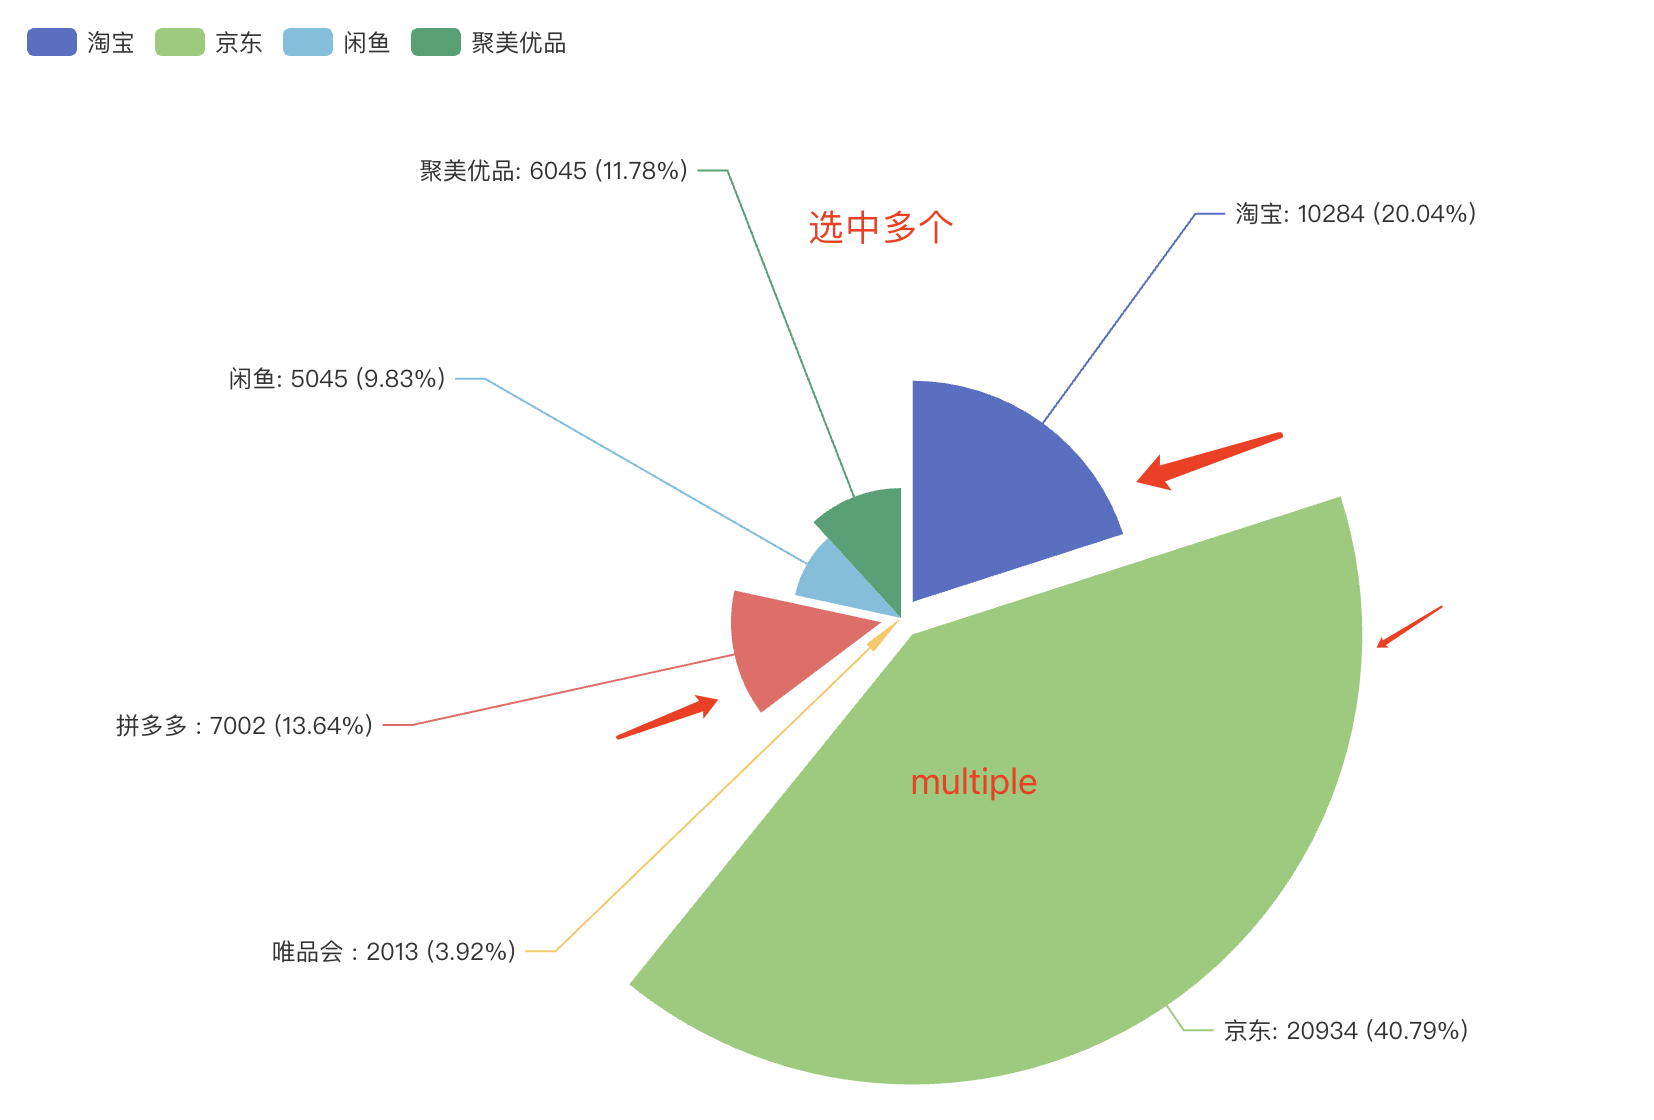
multiple 效果
地图
geo 配置文档
geo 地理工具在线生成
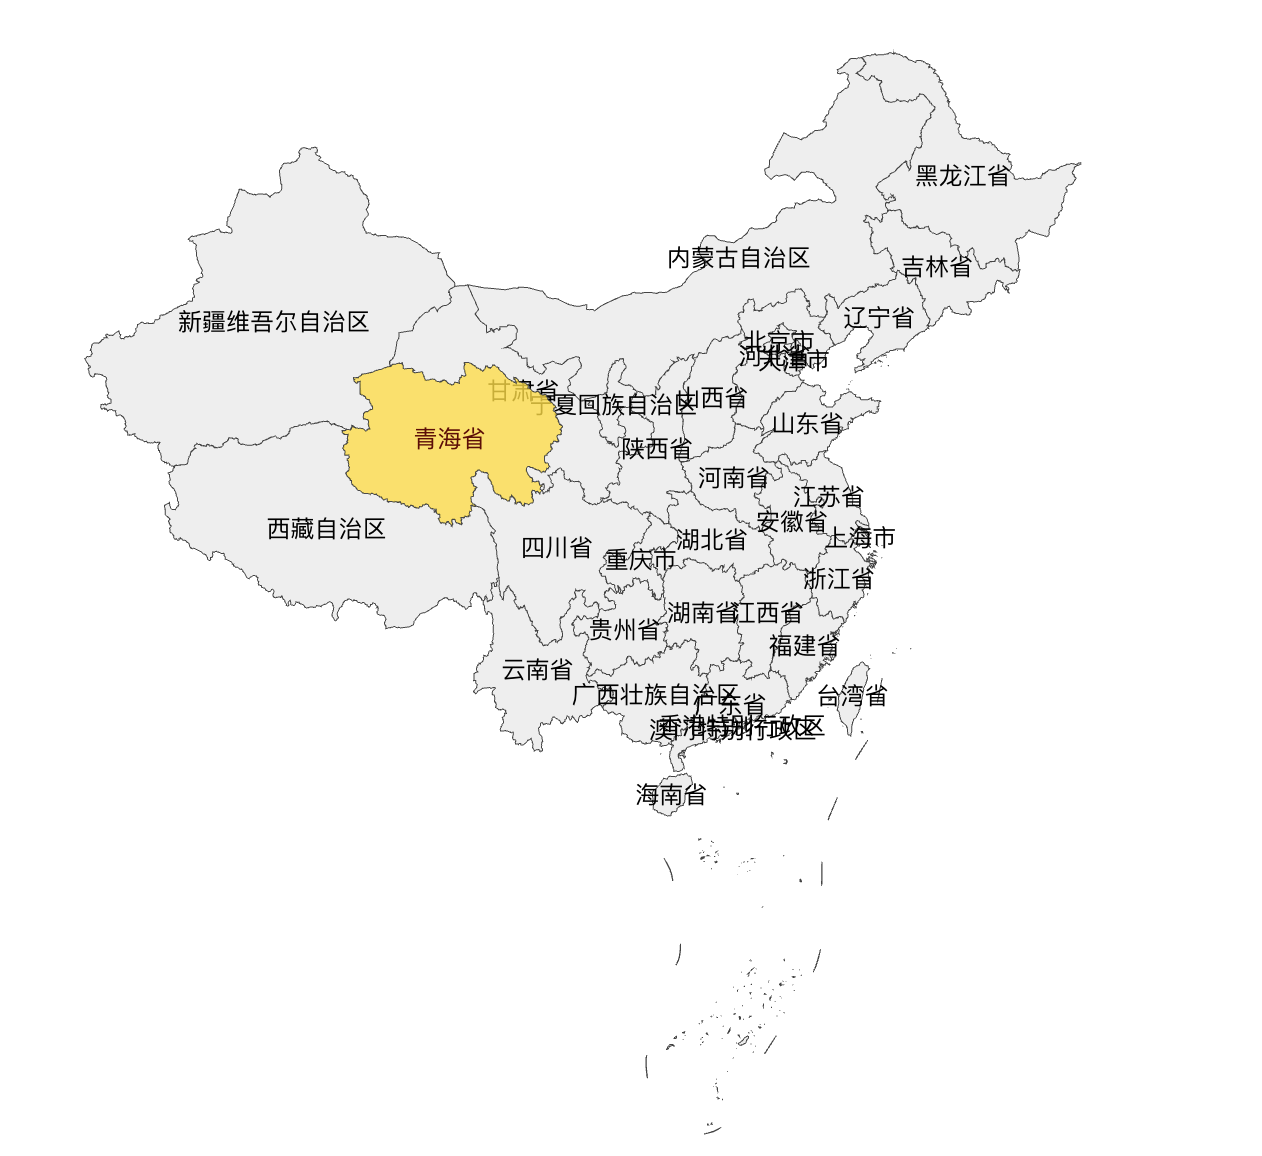
注意:地图是通过
geo属性配置
{
  geo: {
    type: "map",
    map: "chinaMap",
    // 地图缩放级别
    zoom: 1.5,
    // 滚轮缩放
    roam: true,
    label: {
        show: true,
    }
  },
};
然后通过获取
json地理数据后通过registerMap方法进行注册!
methods: {
  initChart(el, options) {
    let myChart = echarts.init(el);
    myChart.setOption(options);
  },
},
mounted() {
  this.$nextTick(() => {
    axios
      .get("https://geo.datav.aliyun.com/areas_v3/bound/100000_full.json")
      .then((res) => {
        echarts.registerMap("chinaMap",res.data)
        this.initChart(this.$refs.mapRef, mapOpitons);
      });
  });
},
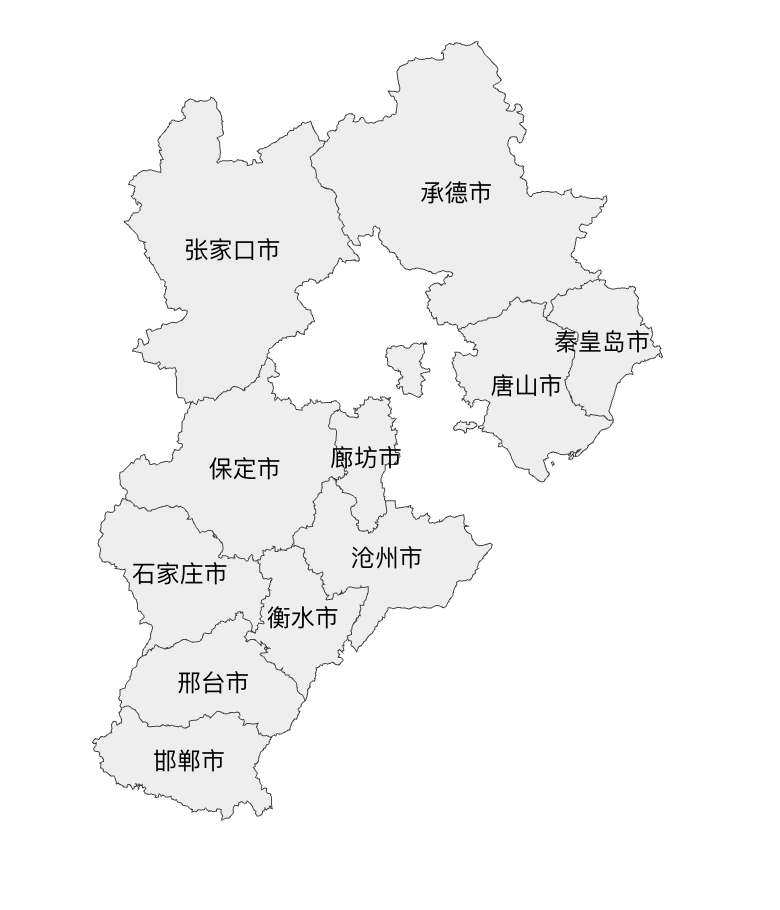
显示省份
在阿里
geo地理信息生成工具,选择省份后复制链接即可!
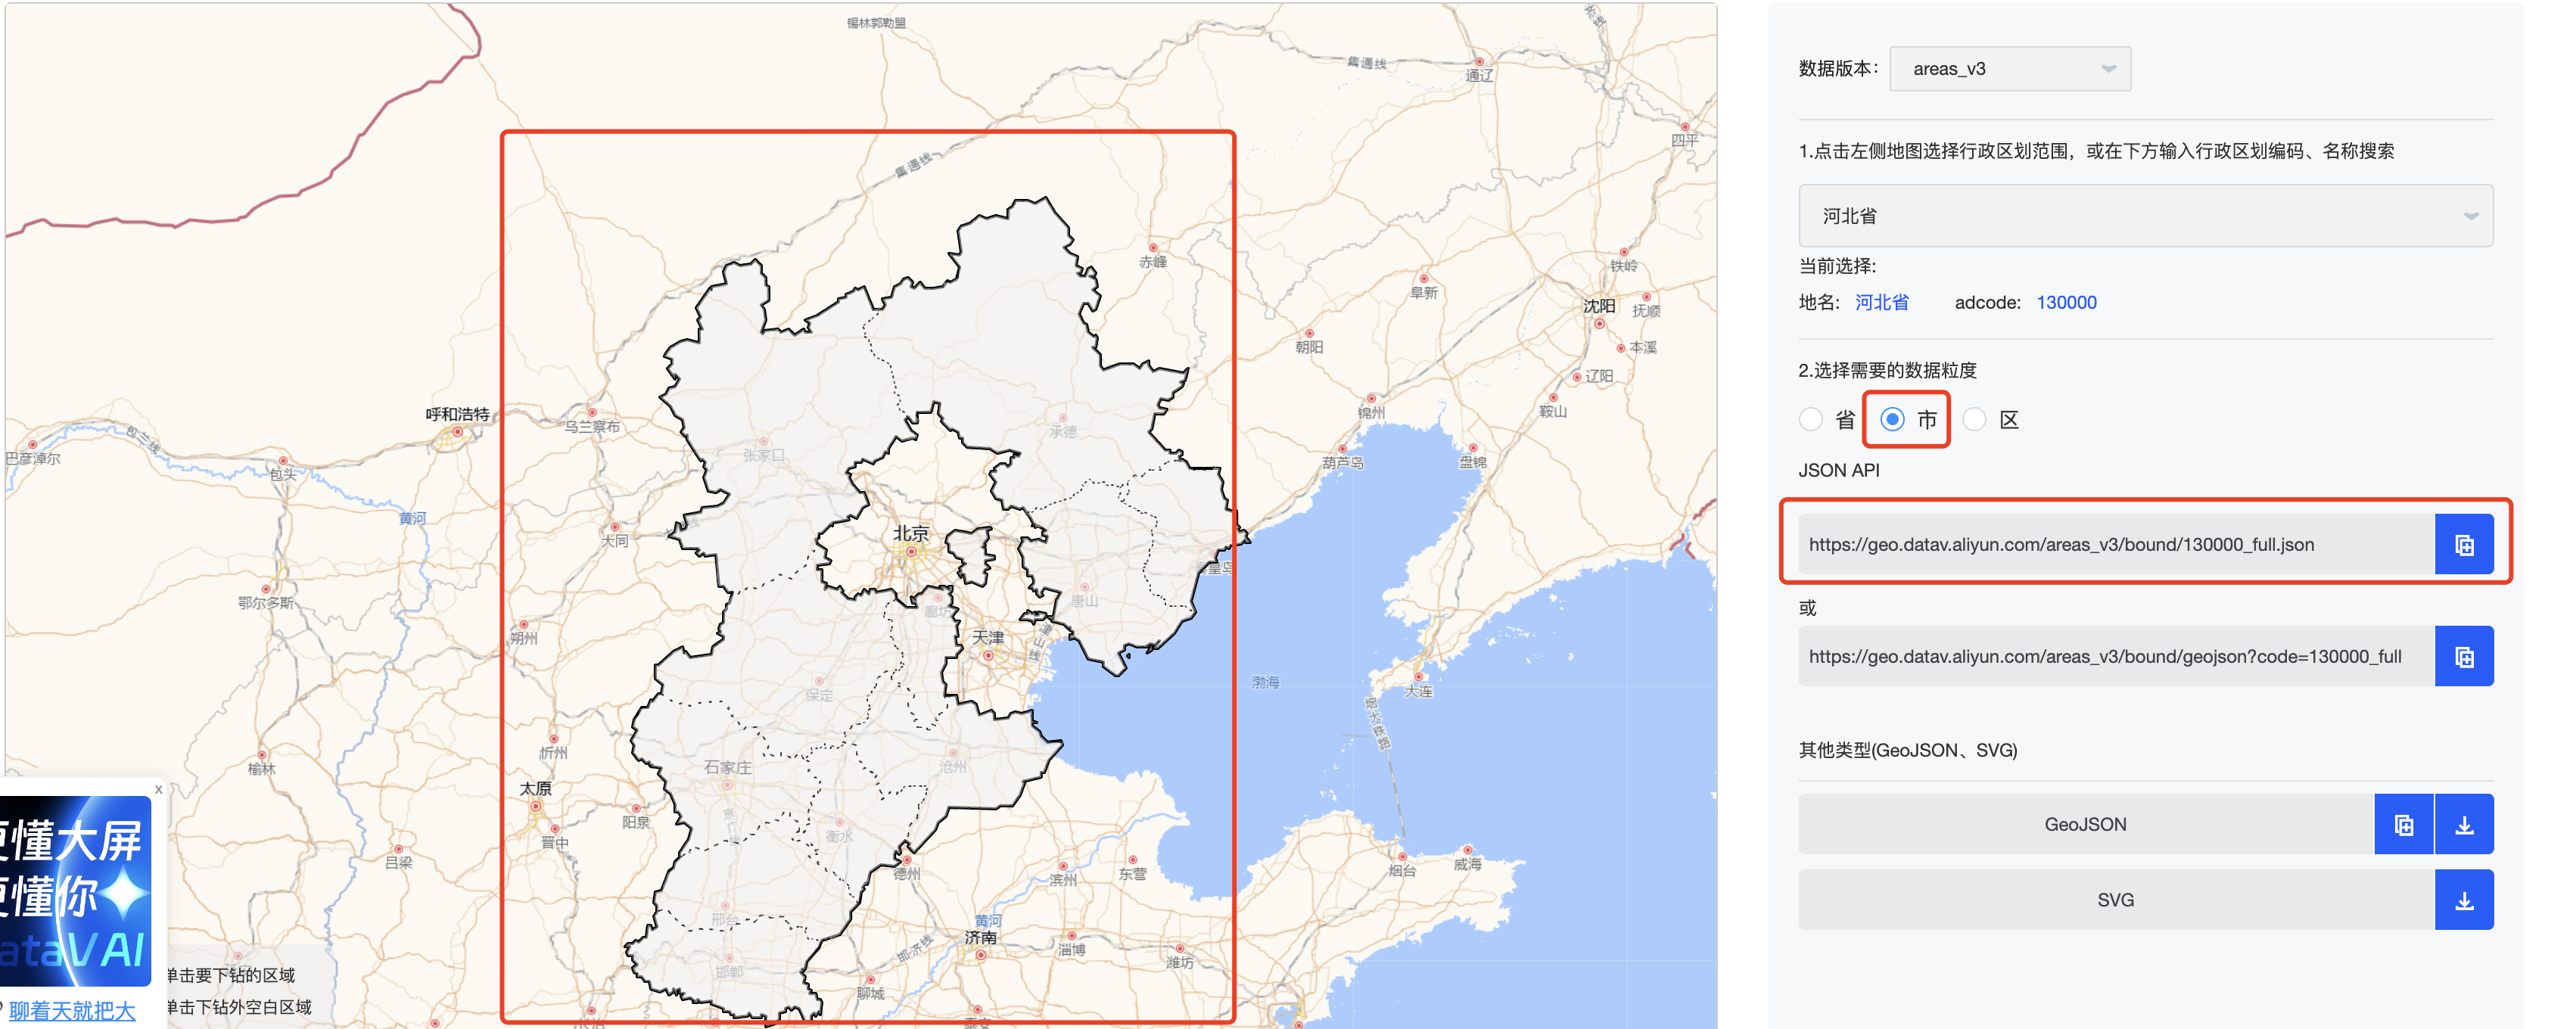
 axios
      .get("https://geo.datav.aliyun.com/areas_v3/bound/130000_full.json")
      .then((res) => {
        echarts.registerMap("chinaMap",res.data)
        this.initChart(this.$refs.mapRef, mapOpitons);
      });
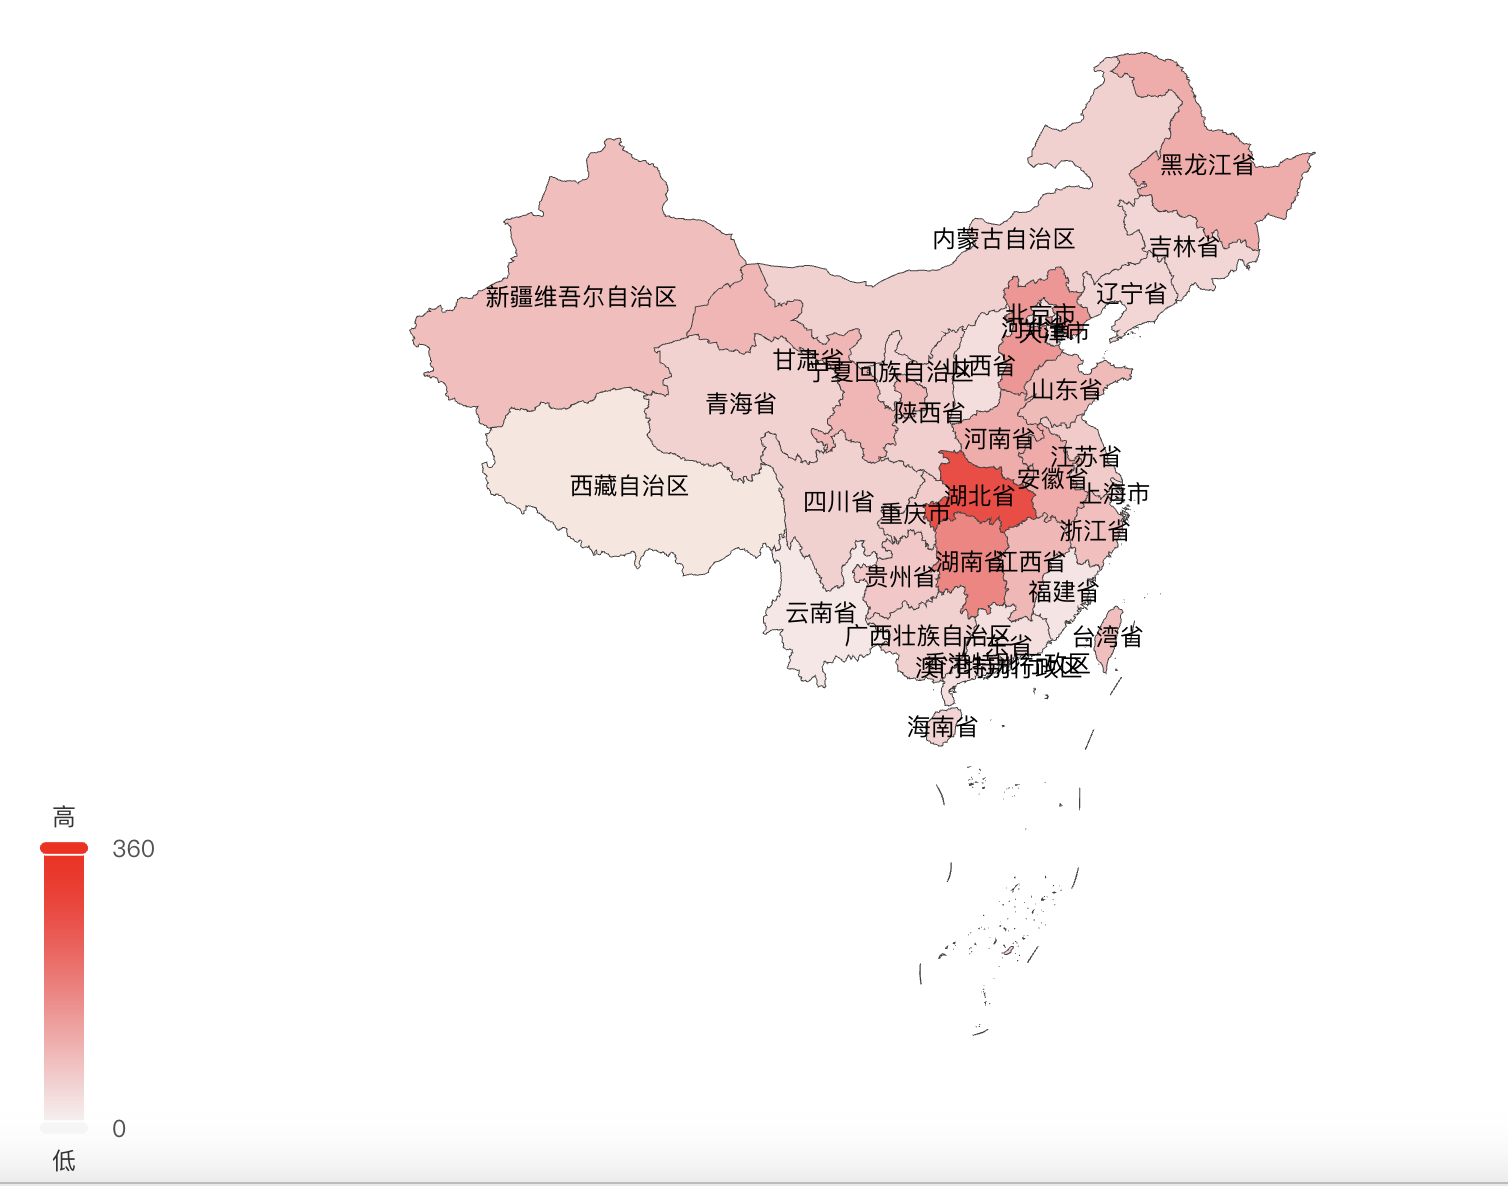
不同地区空气质量显示
visualMap 相关配置!
geo 相关配置!
通过
visualMap和series配合geo实线各个地区空气质量显示!
visualMap是视觉映射组件,用于进行『视觉编码』,也就是将数据映射到视觉元素(视觉通道)。
const data = [
  { name: "北京市", value: 39.92 },
  { name: "天津市", value: 39.13 },
  { name: "上海市", value: 31.22 },
  { name: "重庆市", value: 66 },
  { name: "河北省", value: 147 },
  { name: "河南省", value: 113 },
  { name: "云南省", value: 25.04 },
  { name: "辽宁省", value: 50 },
  { name: "黑龙江省", value: 114 },
  { name: "湖南省", value: 175 },
  { name: "安徽省", value: 117 },
  { name: "山东省", value: 92 },
  { name: "新疆维吾尔自治区", value: 84 },
  { name: "江苏省", value: 67 },
  { name: "浙江省", value: 84 },
  { name: "江西省", value: 96 },
  { name: "湖北省", value: 273 },
  { name: "广西壮族自治区", value: 59 },
  { name: "甘肃省", value: 99 },
  { name: "山西省", value: 39 },
  { name: "内蒙古自治区", value: 58 },
  { name: "陕西省", value: 61 },
  { name: "吉林省", value: 51 },
  { name: "福建省", value: 29 },
  { name: "贵州省", value: 71 },
  { name: "广东省", value: 38 },
  { name: "青海省", value: 57 },
  { name: "西藏自治区", value: 24 },
  { name: "四川省", value: 58 },
  { name: "宁夏回族自治区", value: 52 },
  { name: "海南省", value: 54 },
  { name: "台湾省", value: 88 },
  { name: "香港特别行政区", value: 66 },
  { name: "澳门特别行政区", value: 77 },
  { name: "南海诸岛", value: 55 },
];
export default {
  series: [
    {
      type: "map",
      data: data,
      geoIndex: 0, // 将空气质量的数据和第0个geo配置关联在一起
    },
  ],
  visualMap: {
    min: 0,
    max: 360,
    text: ["高", "低"],
    realtime: false,
    calculable: true, // 滑块对数据的筛选
    inRange: {
      color: ["#f7f7f7", "#ff0000"],
    },
  },
  geo: {
    type: "map",
    map: "chinaMap",
    zoom: 1.5,
    // 滚轮缩放
    roam: true,
    label: {
      show: true,
    },
  },
};
methods: {
  initChart(el, options) {
    let myChart = echarts.init(el);
    myChart.setOption(options);
  },
},
mounted() {
  this.$nextTick(() => {
    axios
      .get("https://geo.datav.aliyun.com/areas_v3/bound/100000_full.json")
      .then((res) => {
        echarts.registerMap("chinaMap",res.data)
        this.initChart(this.$refs.mapRef, mapOpitons);
      });
  });
}
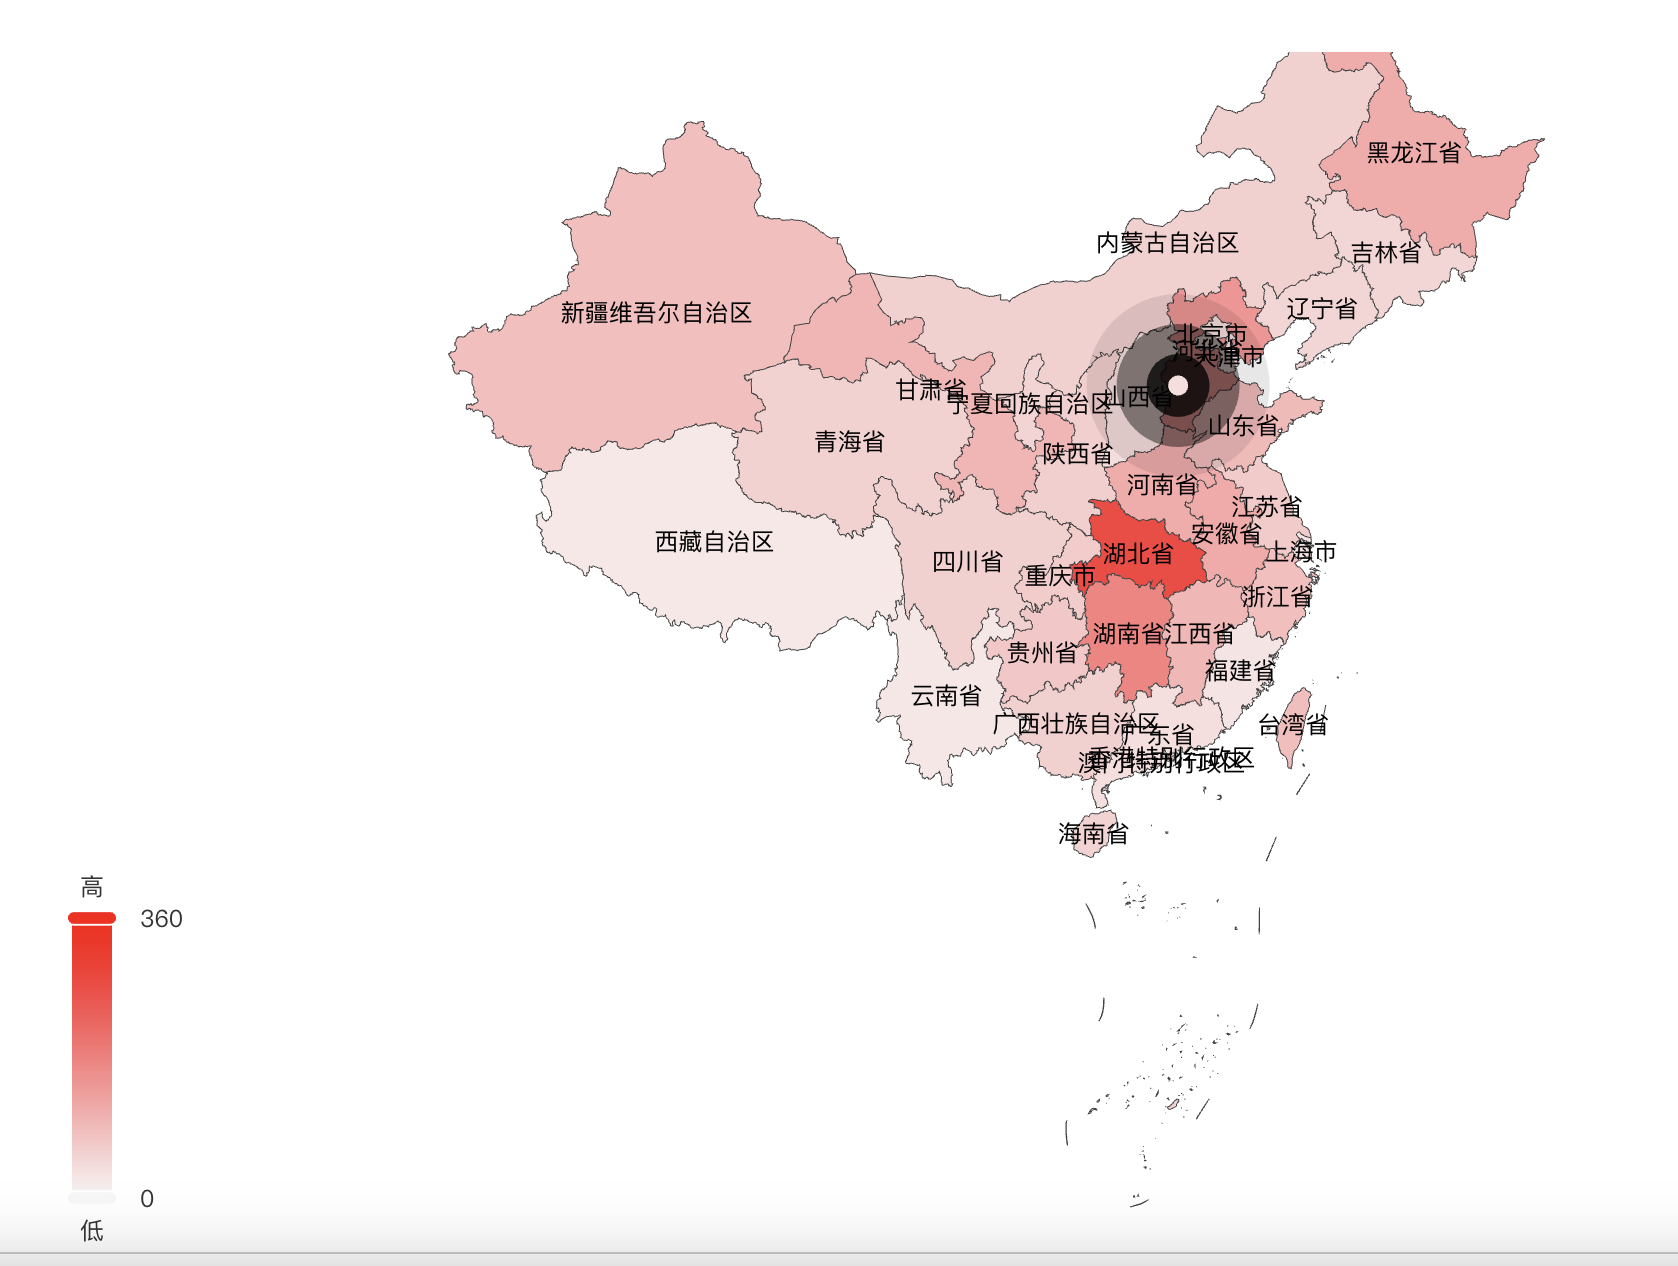
在地图上加入散点图
在
series配置散点图对象,并指定坐标coordinateSystem显示为geo,且给series加入经纬度坐标数据!
export default {
  series: [
    {
      type: "map",
      data: data,
      geoIndex: 0, // 将空气质量的数据和第0个geo配置关联在一起
    },
    // 地图上添加涟漪动画
    {
      type: "effectScatter",
      coordinateSystem: "geo", // 指明散点坐标系统为 geo坐标系统
      data: [{ value: [114.502461, 38.045474]  }],
      rippleEffect: { // 配置涟漪动画效果
        // brushType: "stroke", // 选择描边涟漪
        scale: 10, // 涟漪缩放大小
        color: "rgba(255, 0.5)", // 颜色
      },
    },
  ],
  visualMap: {
    min: 0,
    max: 360,
    text: ["高", "低"],
    realtime: false,
    calculable: true,
    inRange: {
      color: ["#f7f7f7", "#ff0000"],
    },
  },
  geo: {
    type: "map",
    map: "chinaMap",
    zoom: 1.5,
    // 滚轮缩放
    roam: true,
    label: {
      show: true,
    },
  },
};
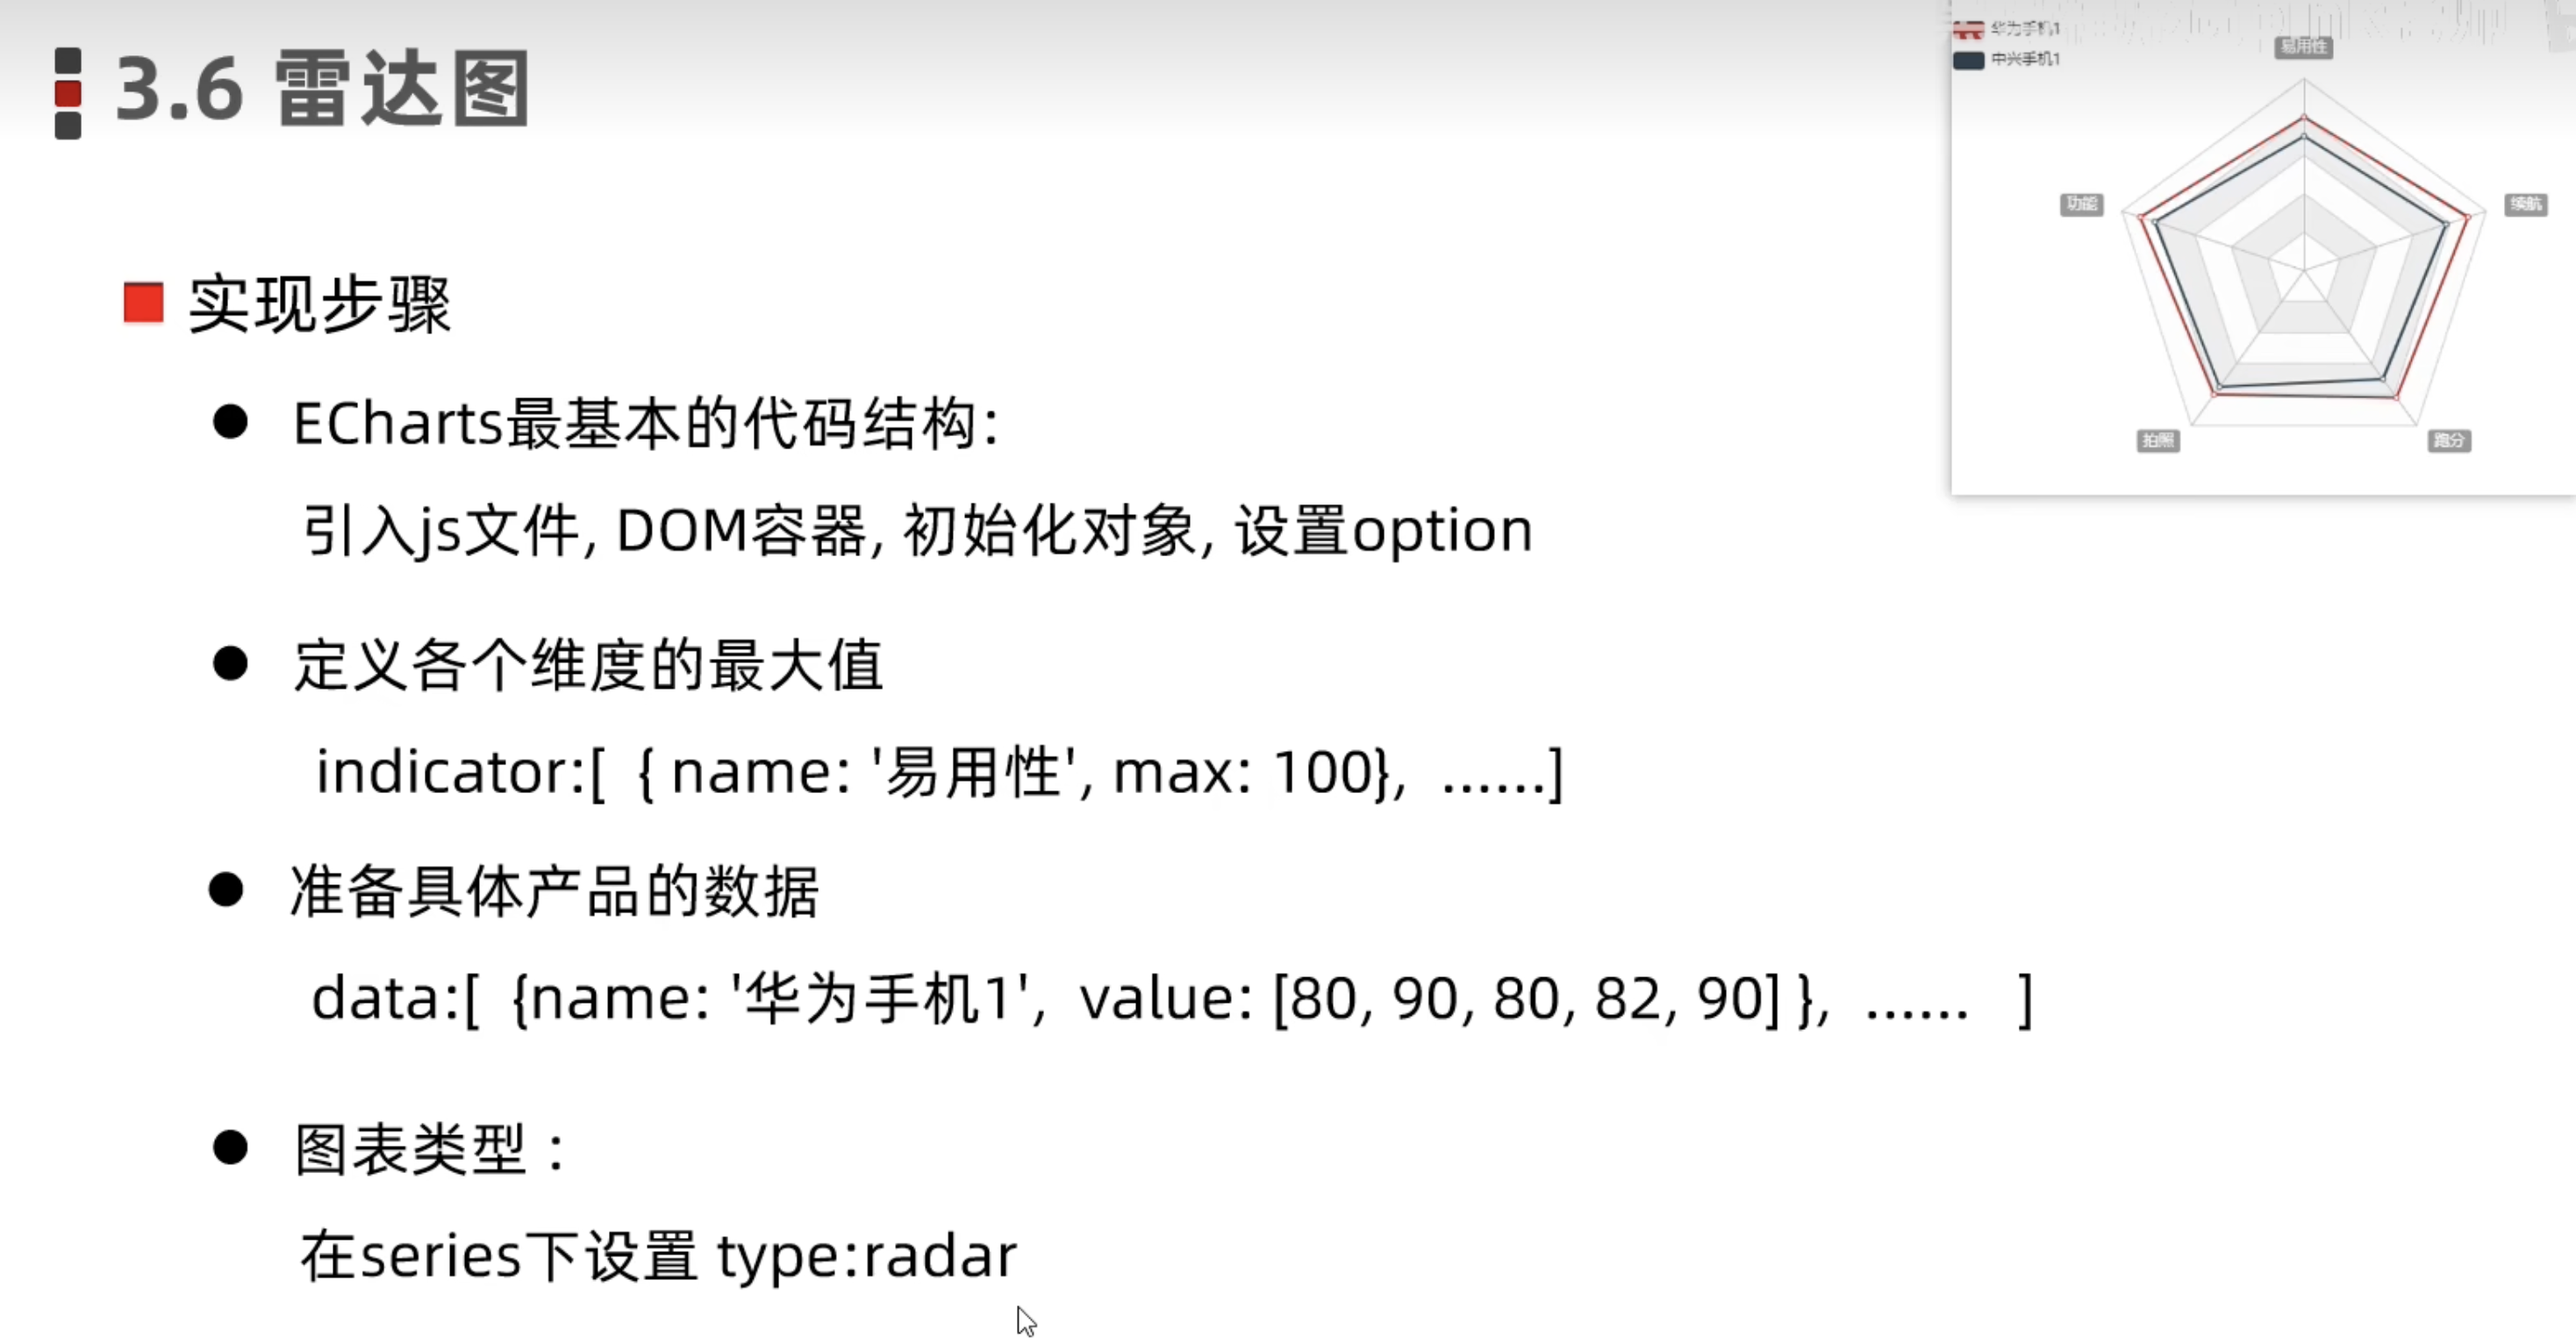
雷达图
radar 雷达图相关配置文档!
{
  // 雷达图配置
  radar: {
    // 配置指示器
    indicator: [
      { name: "易用性", max: 100 },
      { name: "功能", max: 100 },
      { name: "拍照", max: 100 },
      { name: "跑分", max: 100 },
      { name: "续航", max: 100 },
    ],
  },
  series: [
    {
      type: "radar",
      data: [
        { name: "华为手机", value: [90, 80, 70, 60, 50] },
        { name: "小米手机", value: [80, 70, 60, 50, 40] },
      ],
    },
  ],
};
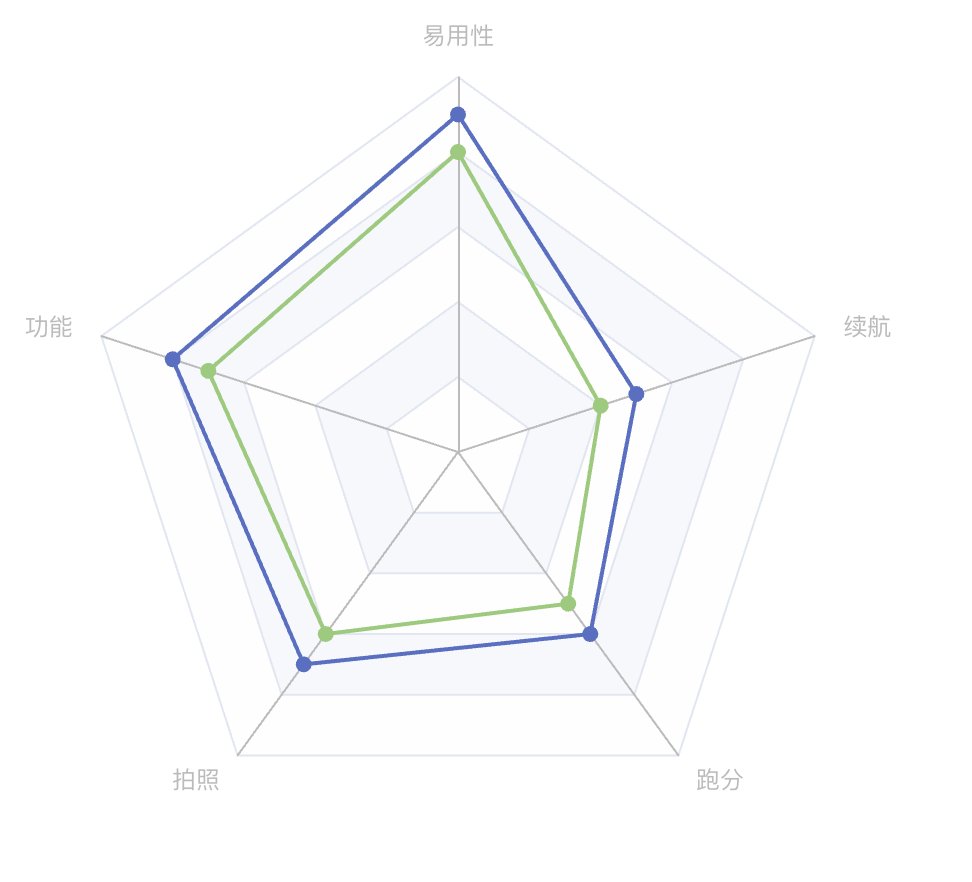
shape: "circle"通过该属性,可以设置radar边缘为原型,通过areaStyle: {}可以配置radar进行颜色填充!
{
  // 雷达图配置
  radar: {
    // 配置指示器
    indicator: [
      { name: "易用性", max: 100 },
      { name: "功能", max: 100 },
      { name: "拍照", max: 100 },
      { name: "跑分", max: 100 },
      { name: "续航", max: 100 },
    ],
    shape: "circle", // circle 圆形 和 polygon 多边形
  },
  series: [
    {
      type: "radar",
      areaStyle: {},
      data: [
        { name: "华为手机", value: [90, 80, 70, 60, 50] },
        { name: "小米手机", value: [80, 70, 60, 50, 40] },
      ],
    },
  ],
};
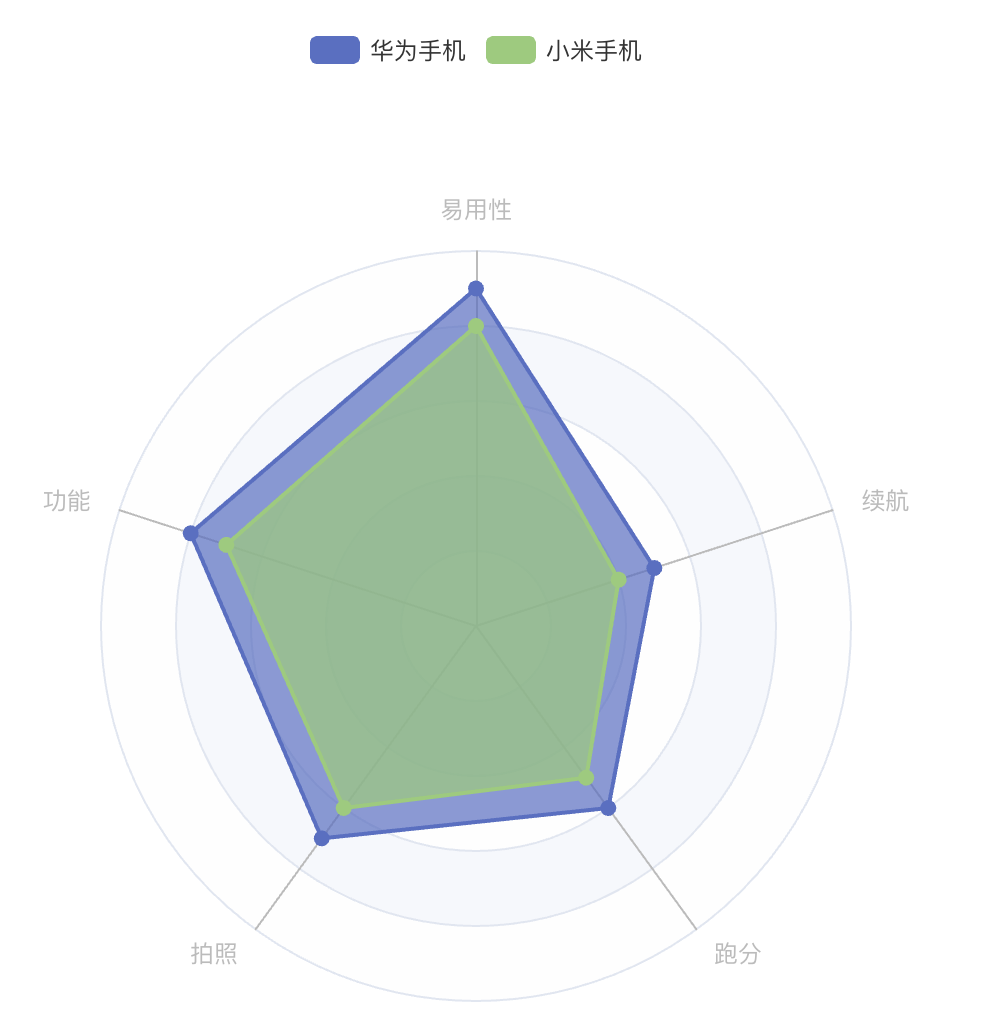
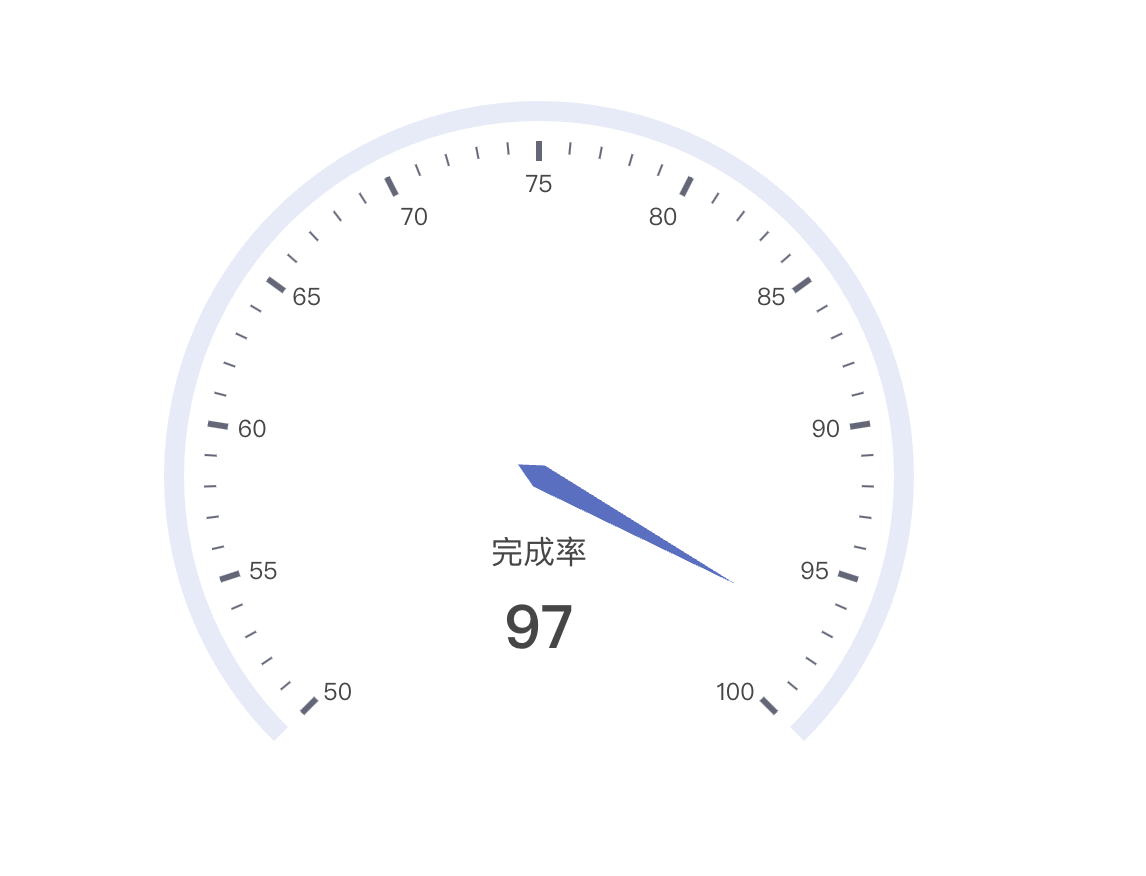
仪表盘
gauge 相关配置文档!
{
  series: [
    {
      type: "gauge",
      min: 50,
      data: [
        {
          value: 97,
          name: "完成率",
        }
      ],
    },
  ],
}
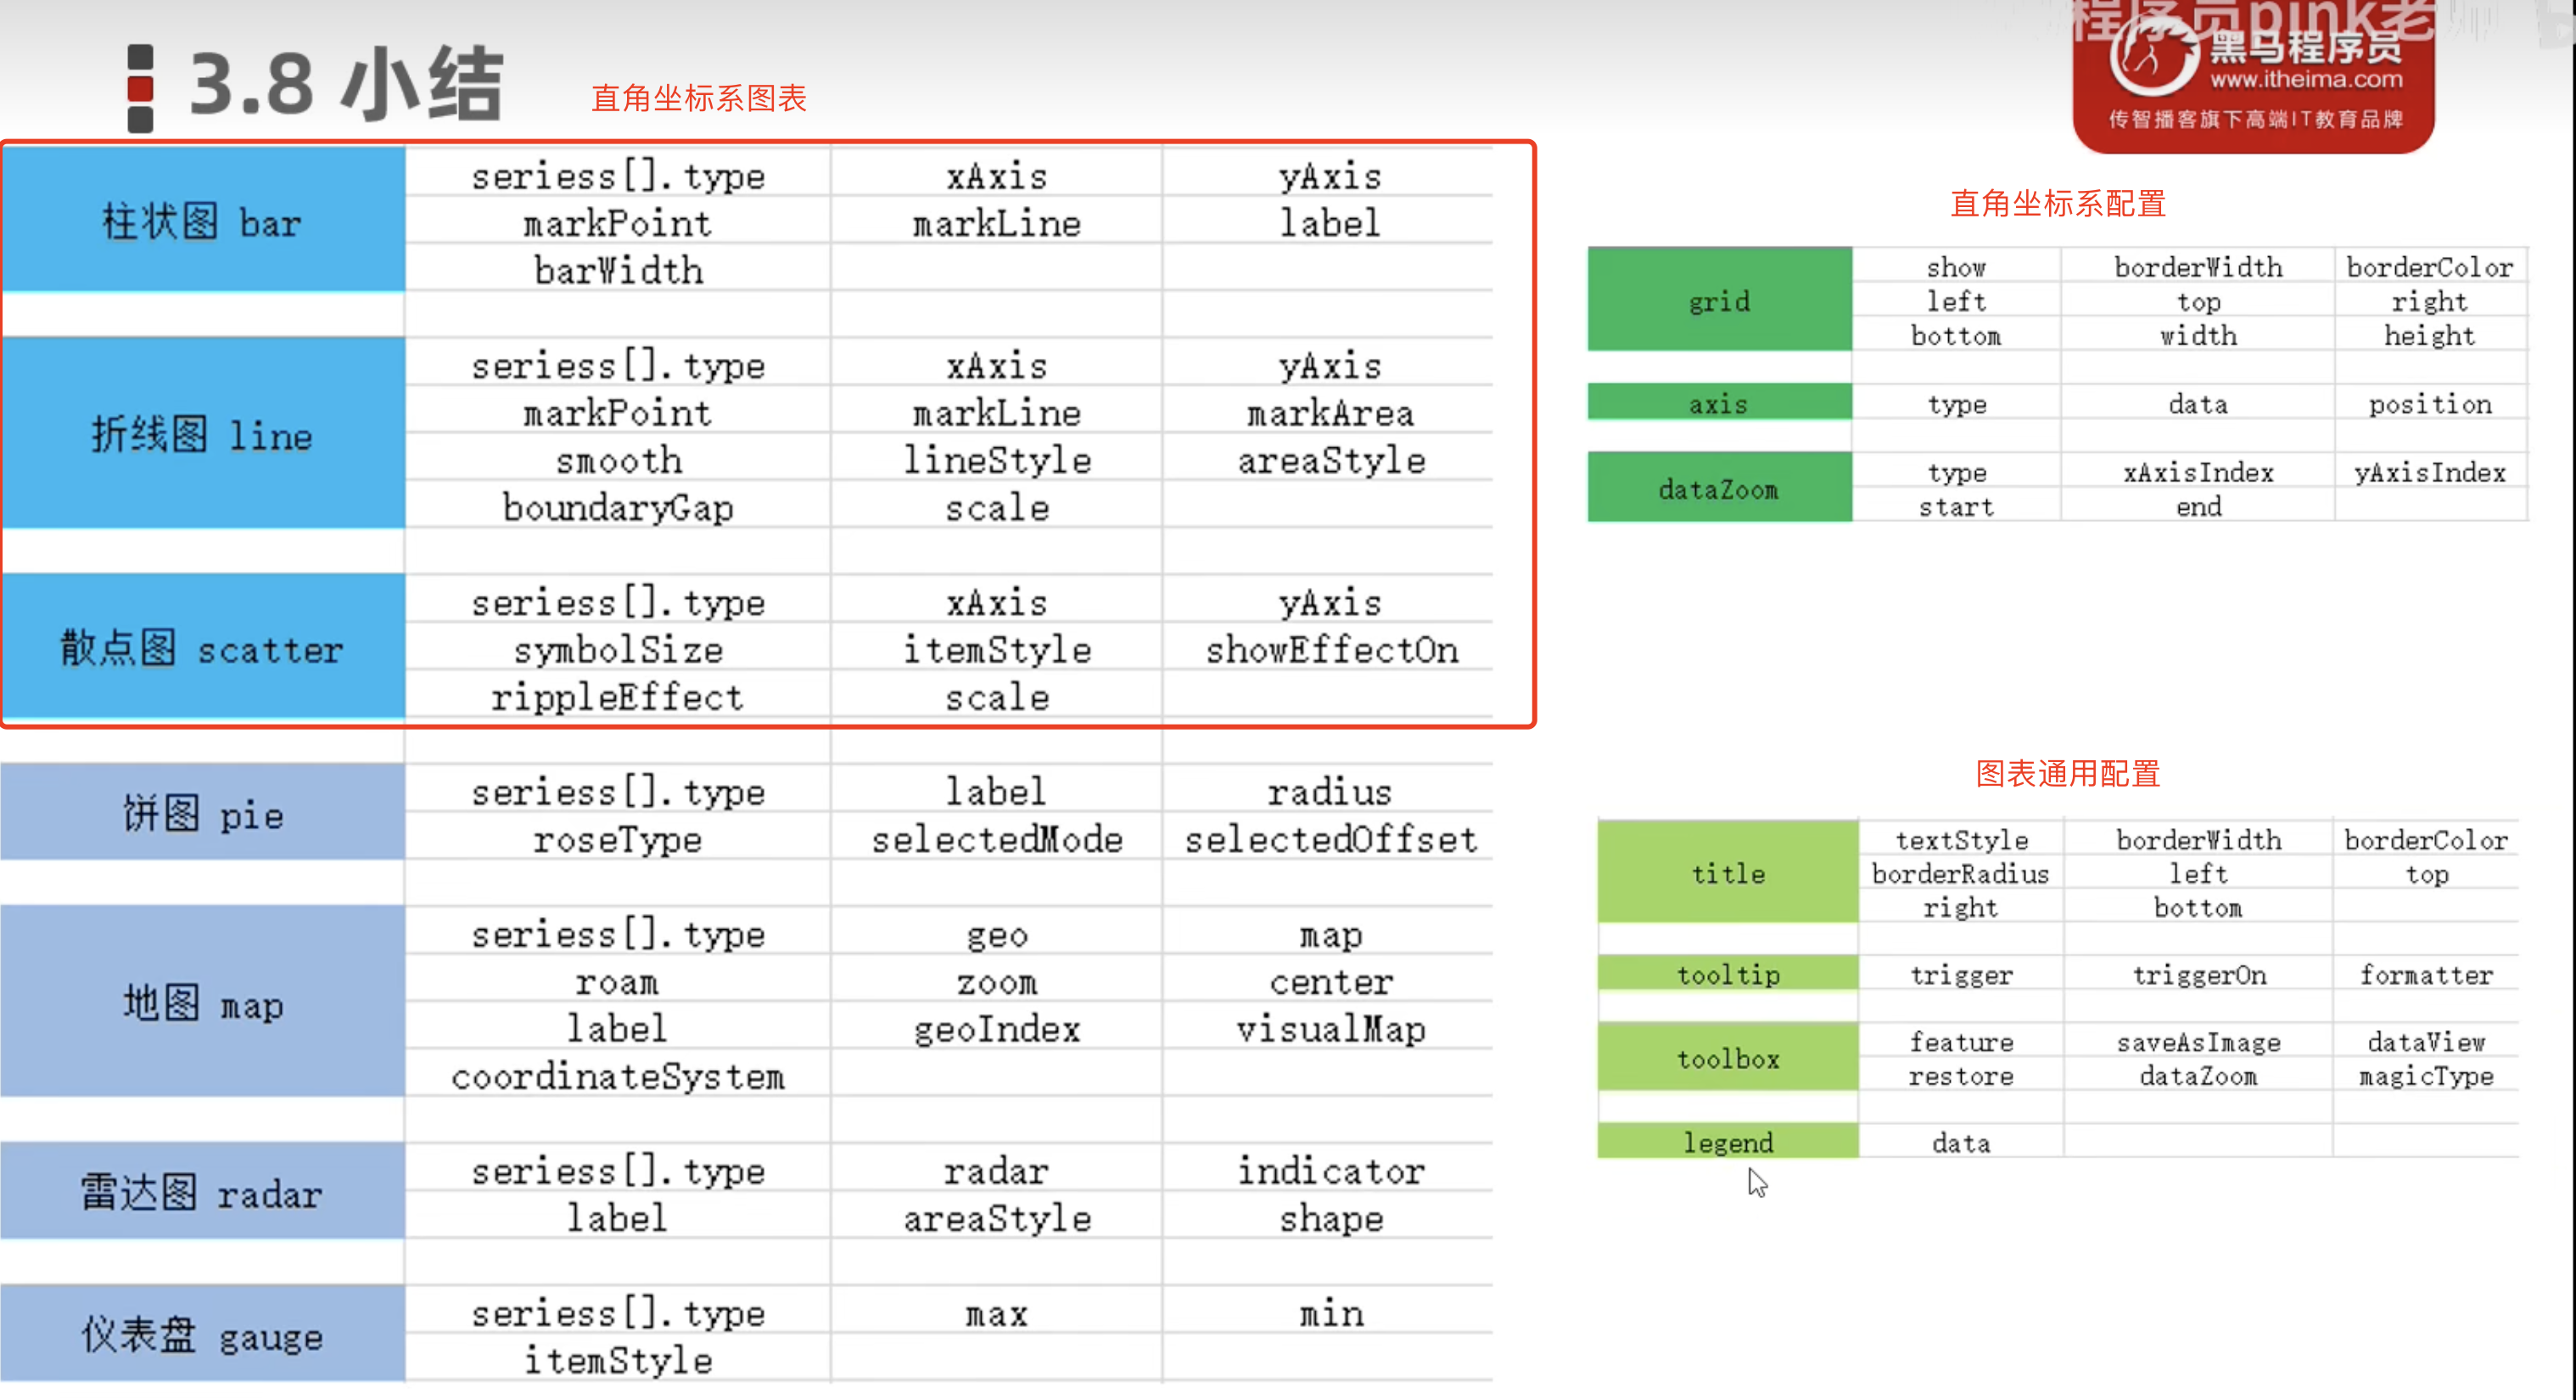
常用图表总结
Echarts常用样式
显示相关
主题
Echarts官方有自己内置的主题,也提供了在线自定义主题!
Echarts 自定义主题地址!
对于主题的使用,我们在通过
init初始化dom时,可以通过第二个参数来传递主题的名称即可!
// light or dark
let myChart = echarts.init(el, "light");
myChart.setOption(options);
当然,也可以通过
API的形式调用registerTheme()方法传入主题配置项进行主题注册!注册主题,用于初始化实例的时候指定。
registerTheme API文档地址!
const theme ={
    color: [
        '#2ec7c9', '#b6a2de', '#5ab1ef', '#ffb980', '#d87a80',
        '#8d98b3', '#e5cf0d', '#97b552', '#95706d', '#dc69aa',
        '#07a2a4', '#9a7fd1', '#588dd5', '#f5994e', '#c05050',
        '#59678c', '#c9ab00', '#7eb00a', '#6f5553', '#c14089'
    ]
}
echarts.registerTheme('themes', theme);// 主题名称 和 主题对象
调色版
它是一组颜色, 图形 和 系列会自动从中获取颜色!
主题调色盘:自定义主题后下载主题文件,进行主题注册时,其主题文件内部就定义好了colorPalette字段!全局调色盘:在options中配置color字段!局部调色盘:是在series单独配置color字段,echarts会覆盖全局和主题颜色 !
全局调色盘
{
  color: ['red','blue','yellow','green','pink']
}
局部调色盘
{
  series: [
    {
      type: "pie",
      data: [],
      color: ['red','blue','yellow','green','pink']
    }
  ]
}
渐变
渐变色,分为
线性渐变,和径向渐变!
线性渐变:就是由某一端点到另一个端点的一个渐变过程!
径向渐变:就是由中间一点像外围进行扩散的渐变过程!
线性渐变 linear
{
  itemStyle: {
    // color: "#24a2f0", // 图形颜色
    color: {
      type: "linear",
      x: 0,
      y: 0,
      x2: 0,
      y2: 1,
      colorStops: [
        {
          offset: 0,
          color: "#17ead9", // 渐变起始颜色
        },
        {
          offset: 1,
          color: "#6078ea", // 渐变结束颜色
        },
      ],
    },
    borderRadius: 5, // 图形圆角
    shadowColor: "rgba(0, 0, 0, 0.8)", // 阴影的颜色
    shadowBlur: 10, // 阴影的模糊度
  }
}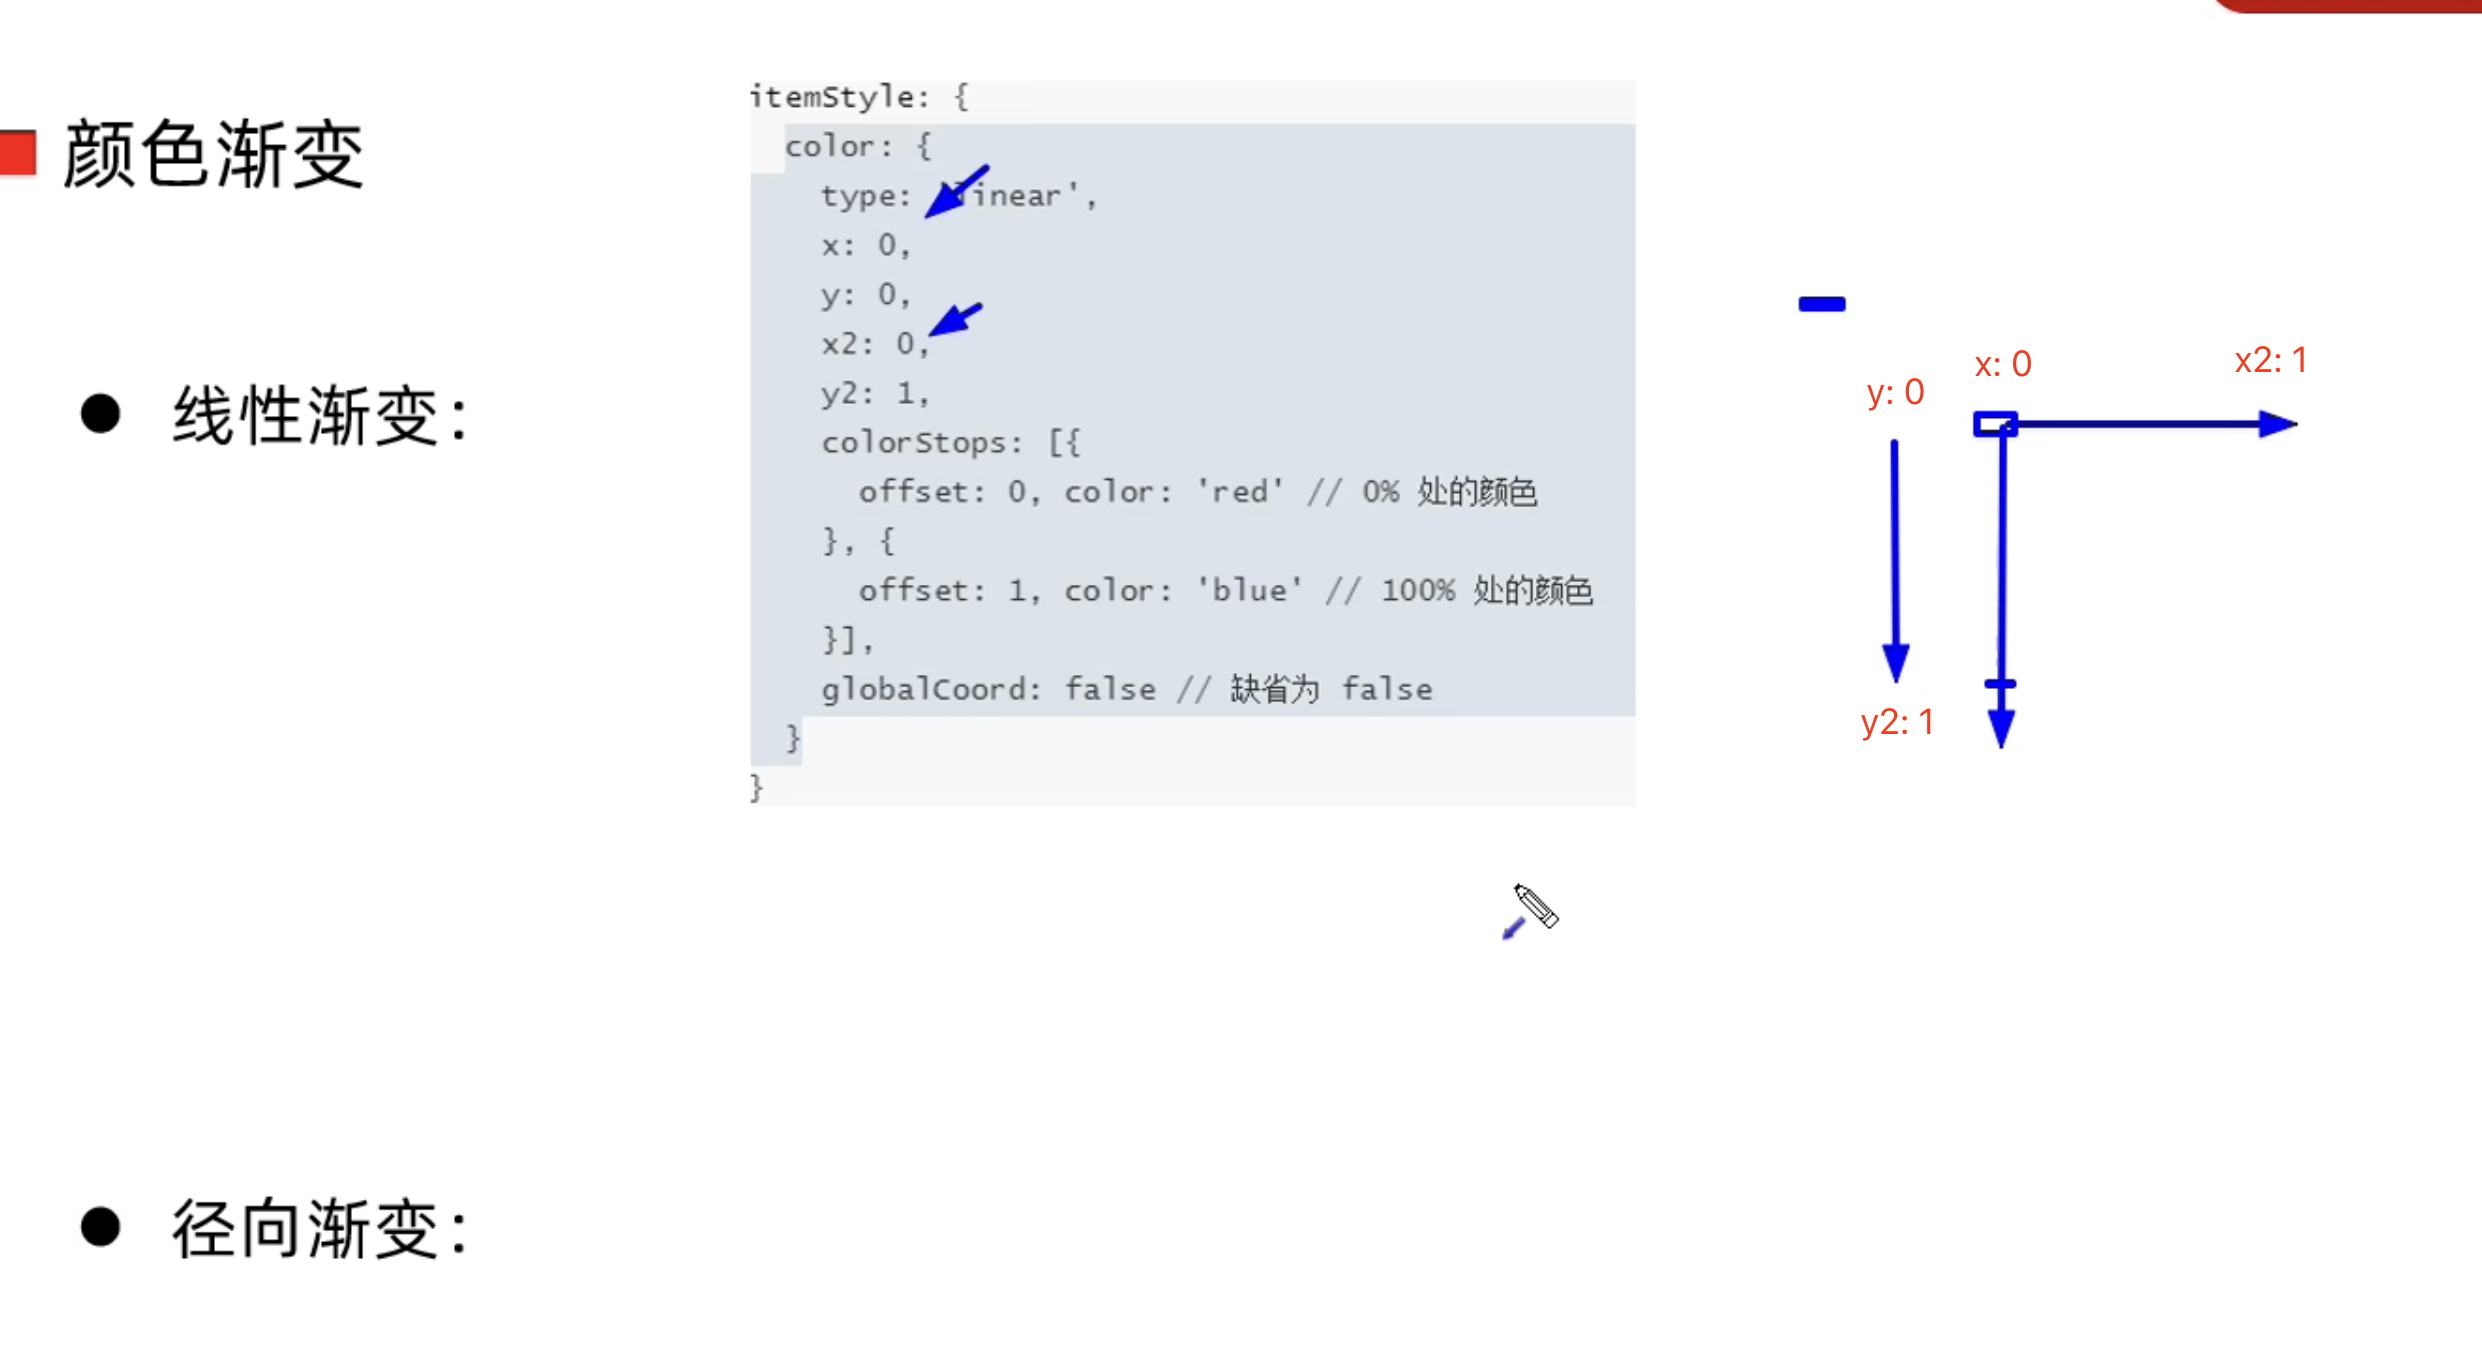
x: 0和x2: 0就是x轴的起点坐标!
y: 0和y2: 1就是 y轴起点到y2: 1终点坐标!
径向渐变 radial
{
  itemStyle: {
    // color: "#24a2f0", // 图形颜色
    color: {
      type: "linear",
      x: 0.5,
      y: 0.5,
      r: 0.5, // 半径
      colorStops: [
        {
          offset: 0,
          color: "#17ead9", // 渐变起始颜色
        },
        {
          offset: 1,
          color: "#6078ea", // 渐变结束颜色
        },
      ],
    }
}
样式
样式分为
直接样式和高亮样式
直接样式:itemStyle图表样式textStyle标题样式lineStyle折线图样式areaStyle区域样式label标签样式!
高亮样式:就是鼠标滑动所产生的样式,通过emphasis属性来包裹以上样式即可实现!
直接样式
{
  title: {
    text: "样式",
    textStyle: {
       color: "blue"
    }
  },
  series: [
    {
      type: 'pie',
      data: [].
      itemStyle: {
        color: "red"
      },
      label: {
        color: "yellow"
      }
    }
  ]
}
高亮样式
{
  title: {
    text: "样式",
    textStyle: {
       color: "blue"
    }
  },
  series: [
    {
      type: 'pie',
      data: [].
      itemStyle: {
        color: "red"
      },
      label: {
        color: "yellow"
      },
      emphasis: {
        itemStyle: {
          color: "red"
        },
      }
    }
  ]
}
自适应
echarts图表自适应是通过echarts.resize()方法来实现的!通过监听窗口的变化,来执行
echarts.resize()方法!
window.onresize = function (){
  echarts.resize();
}
// 或者
window.onresize = echarts.resize;
动画相关
加载动画
加载动画就是在加载数据之前时,通过loading形式表现正在加载中,加载数据完成时,则结束加载动画!实线加载动画,通过
echarts实例调用,showLoading和hideLoading两个方法即可!
async initChart(el, options) {
  let myChart = echarts.init(el, "cool");
  myChart.showLoading();
  await delay(function(){
    myChart.setOption(options);
    myChart.hideLoading();
  }, 5000)
  this.bindEvents( myChart )
},
增量动画
增量动画就是数据发生变化新增或修改时,图表所产生的动画!
增量动画是通过setOption API实现的,只需要把关注变化的数据,通过setOption重新设置一次即可!
注意: setOption当设置发生数据变化时,无需把原有的option 选项重新设置,只需要关注 series 下有所变化的 data
// 修改原有的数据
function modify(){
  // 获取原有 options 要变动的数据
  const newData = options.series[0].data.map( item => item + 15 )
  echarts.setOption({
    series: [
      {
        data: newData
      }
    ]
  })
}
当类目轴
category发生变化时,我们只需要更新xAxisseries即可!比如有一个
成绩表,类目轴分别为['小明','小张','小白'],对应的成绩为['60','80','90']现在我要
加一名同学的成绩,那么我就需要更新类目轴,同时需要更新series中所对应同学的成绩!
动画配置项
配置文档!
动画配置项,可以配置
开启动画,动画延迟,动画时长,动画效果(匀速动画,弹性动画等 ),动画阈值!
{
  animation: true, // 是否开启动画 默认开启
  animationDuration: 1000, // 动画时长
  animationEasing: "linear" // 动画效果 匀速 弹性等...默认匀速
}
交互API
echarts全局对象
echarts 全局对象API
交互API就是echarts全局对象所包含的一些方法,例如initregisterThemeregisterMapconnect!
init就是初始化图表所使用的API, 有两个参数,一个中dom元素, 一个是主题的名称!registerTheme就是用来注册自定义主题的,第一个参数为主题的名称,第二个参数为主题配置对象!https://echarts.apache.org/zh/api.html#echarts.registerTheme registerMap注册可用的地图,只在geo 组件或者map 图表类型中使用。connect多个图表实例实现联动。https://echarts.apache.org/zh/api.html#echarts.connect
echarts实例对象
echartsInstance 实例配置API!
实例对象是通过
echarts.init()方法返回所得到的实例对象!通过实例对象来设置
option等图表一些操作方法!如
setOption配置图表选项on绑定事件off解绑事件clear 清除实例等!
echarts events事件
echarts events 事件!
事件有
鼠标事件和echarts 事件!
鼠标事件: 就是点击事件移入移出事件等相关鼠标操作!
echarts事件: 就是 图表内部组件相关操作事件,如legend 标签操作事件,和title 操作事件等!
echarts actions用户行为
echarts action 行为触发操作!
ECharts中支持的图表行为,通过dispatchAction触发。图表行为,就是模拟用户触发图表行为,比如图表
高亮选中提示等 行为操作!
// 如果要高亮系列:
dispatchAction({
    type: 'highlight',

    // 用 index 或 id 或 name 来指定系列。
    // 可以使用数组指定多个系列。
    seriesIndex?: number | number[], // series 系列索引
    seriesId?: string | string[],
    seriesName?: string | string[],

    // 数据项的 index,如果不指定也可以通过 name 属性根据名称指定数据项
    dataIndex?: number | number[], // 展示数据索引
    // 可选,数据项名称,在有 dataIndex 的时候忽略
    name?: string | string[],
});

// 如果要高亮 geo 组件(从 `v5.1.0` 开始支持):
dispatchAction({
    type: 'highlight',

    // 用 index 或 id 或 name 来指定 geo 组件。
    // 可以用数组指定多个 geo 组件。
    geoIndex?: number | number[],
    geoId?: string | string[],
    geoName?: string | string[],

    // geo 组件中 region 名称。
    // 可以是一个数组指定多个名称。
    name?: string | string[],
});
koa2后台搭建
具体参考这篇文章
https://blog.ppxiong.top/archives/4533fab6ded26a4d70785b531d9d8d3c6c6a

